Galactic Visitor's Guide to America
The Galactic Visitor's Guide to America does not ask whether UFOs exist. Instead, it asks: what do our reports of them—where we see them, how we describe them, when we choose to report them—reveal about the cultural, environmental, and psychological contexts that shape human perception? By adopting a speculative alien perspective, the visualization creates critical distance that allows viewers to see familiar data, and their own interpretive impulses, with fresh eyes.
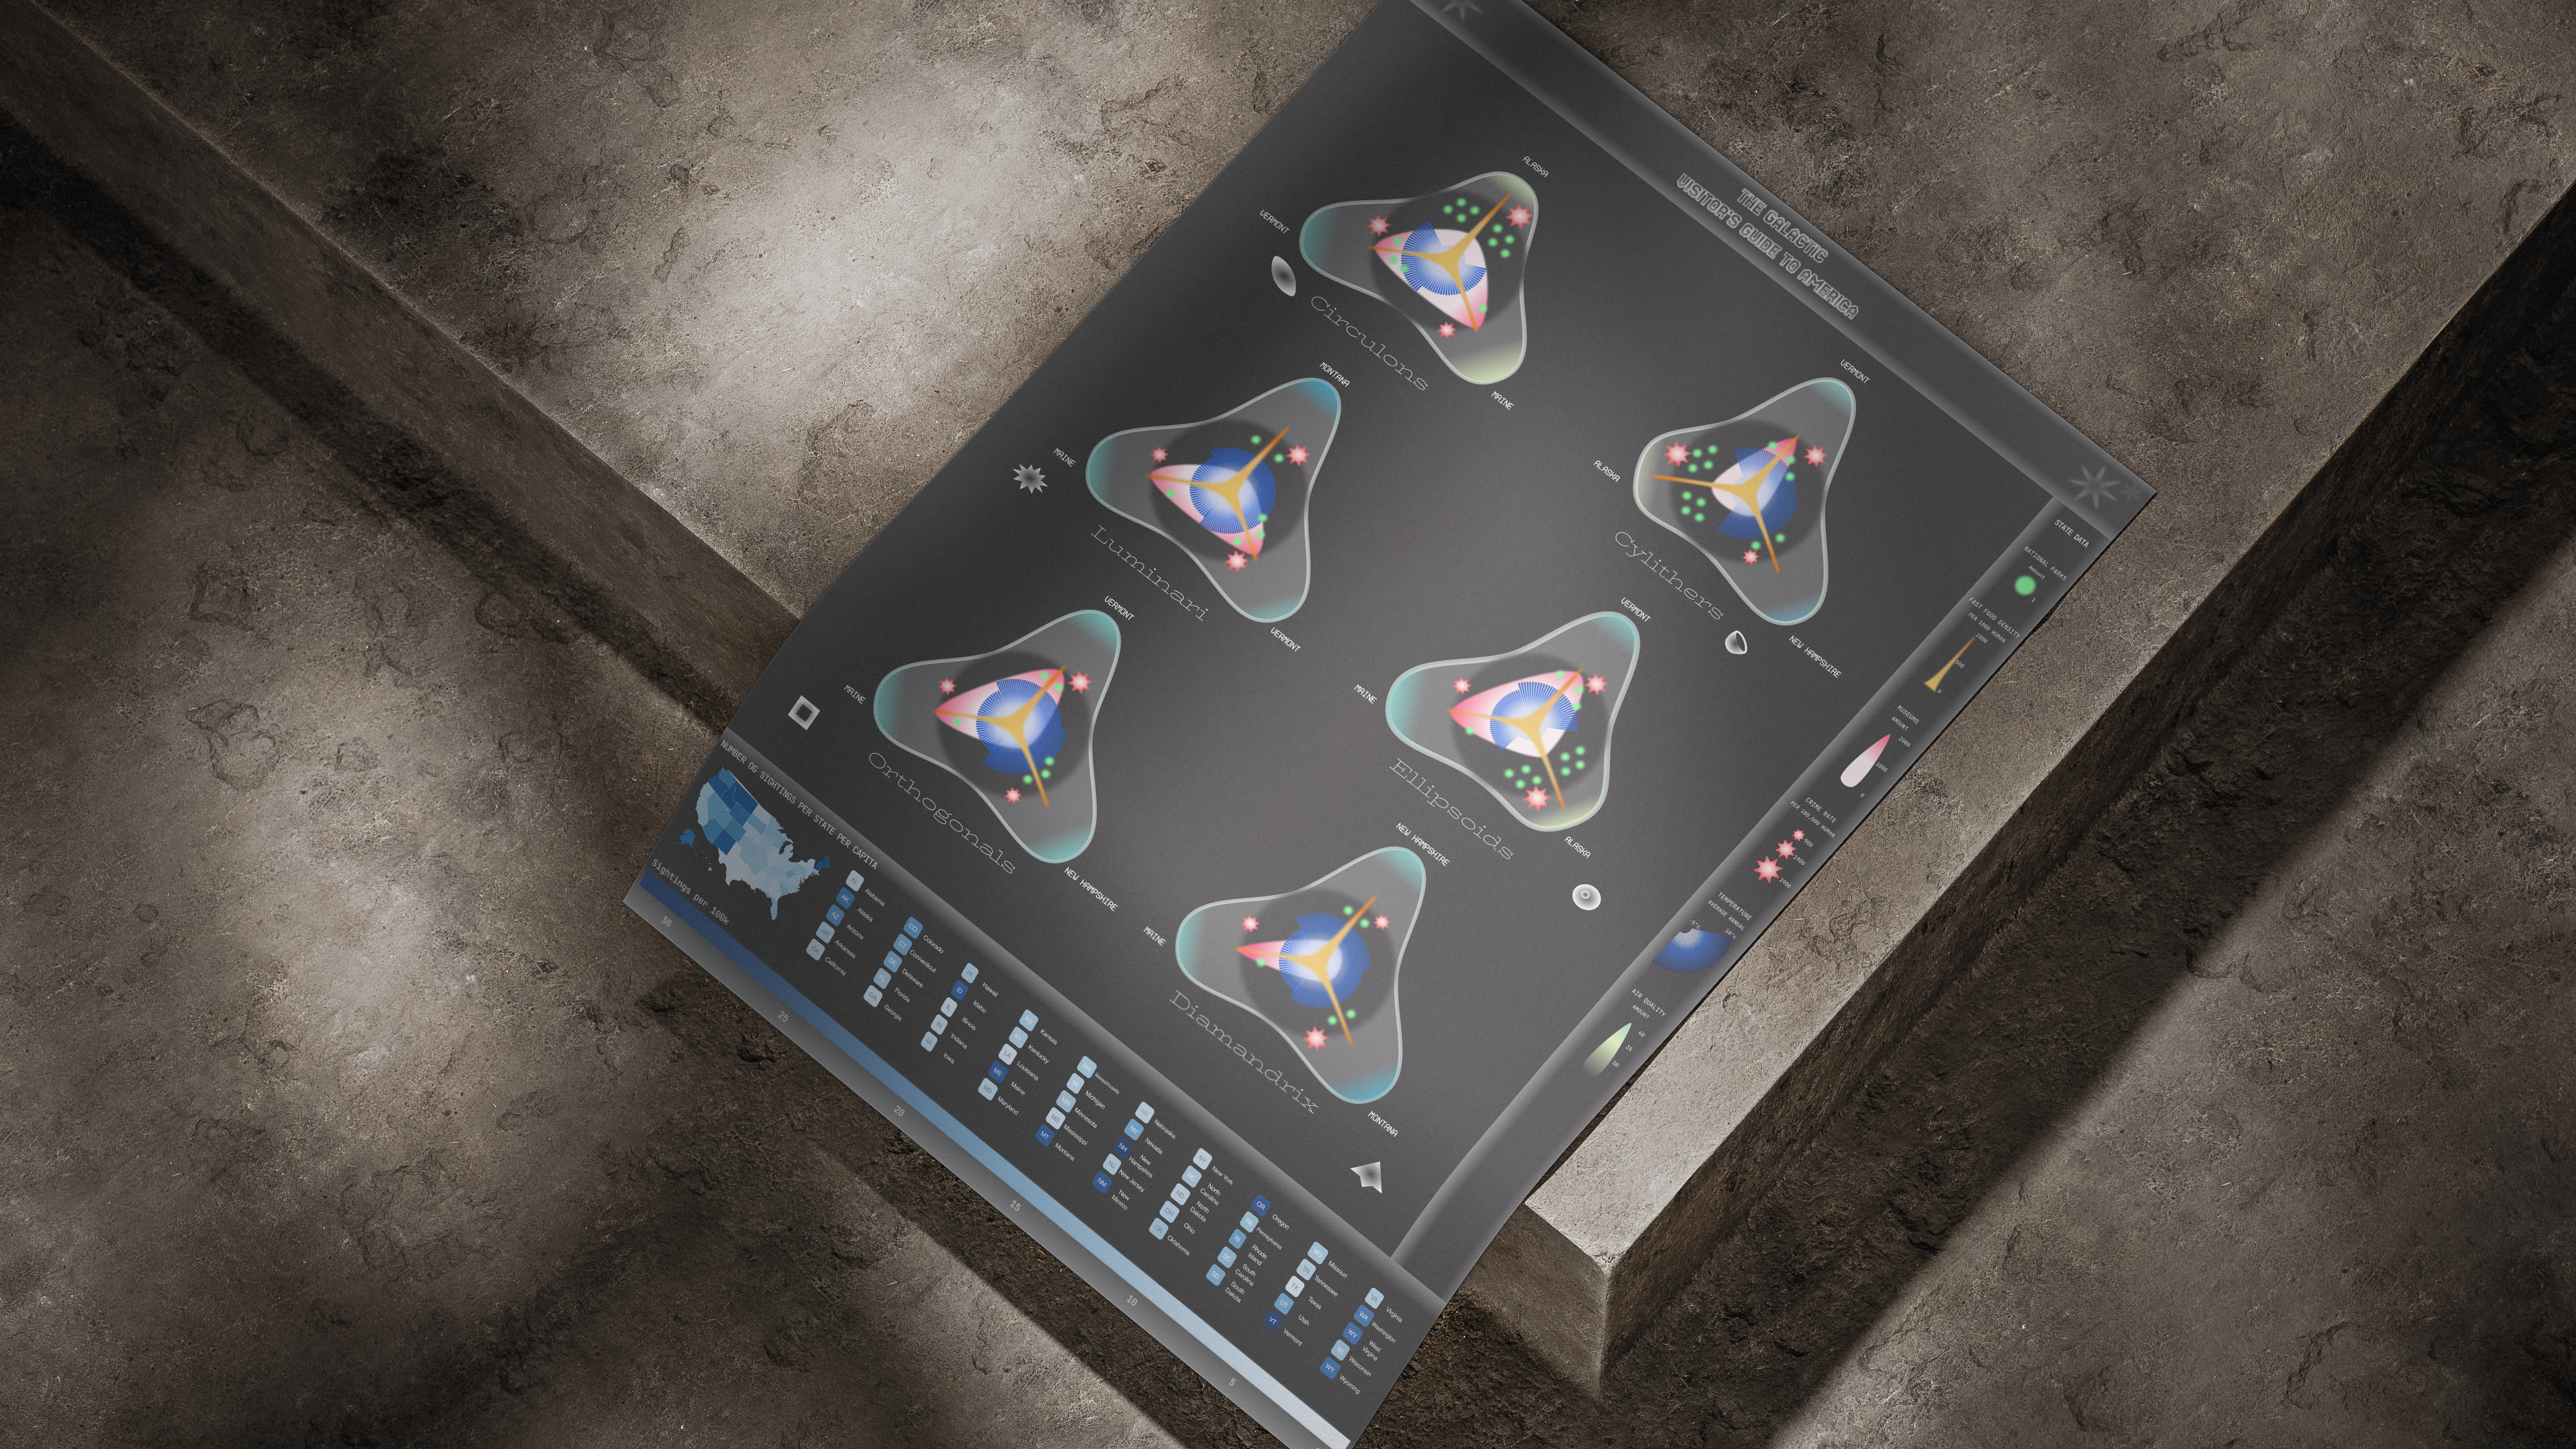
Abstract
The Galactic Visitor's Guide to America is a speculative data visualization that reframes UFO sighting records as an extraterrestrial tourism guide. By analyzing 60,000+ reports from the National UFO Reporting Center (NUFORC) alongside contextual state-level data—climate, political composition, crime statistics, cultural infrastructure—the project interrogates how environmental and social factors correlate with reported anomalous phenomena.
Rather than attempting to prove or disprove extraterrestrial activity, the work employs speculative design to expose how human perception, cultural context, and reporting bias shape the patterns we find in ambiguous data. The outcome is a critical reflection on data interpretation itself: how meaning emerges from incomplete information, and how analytical framing determines the stories data can tell.
Research Question
Can reframing anomalous data through fictional scenarios reveal systematic patterns in how we perceive and report unexplained phenomena?
UFO sighting databases represent a unique dataset: thousands of eyewitness reports describing objects that, by definition, resist conventional classification. These reports cluster geographically and temporally, but the question remains: do these patterns reflect actual phenomena, or do they reveal something about the observers themselves?
Traditional statistical approaches treat this data as either signal (evidence of real events) or noise (unreliable testimony). We propose a third approach: treating UFO data as a cultural artifact that reveals patterns of human perception, belief systems, and the social contexts in which people report anomalous experiences.
The speculative premise: If extraterrestrial visitors were real, and different "species" preferred different U.S. states based on local conditions, what would their tourism guide look like?
This framing transforms the research question from "What are UFOs?" to "What do UFO reports reveal about how context shapes observation and interpretation?"
Methodology
1. Data Collection and Processing
Primary Dataset:
National UFO Reporting Center (NUFORC) database—60,000+ sighting reports classified by shape, location, date, and narrative description.
Contextual Datasets:
State-level indicators were collected from government databases, research repositories, and aggregated sources:
- Climate: Average annual temperature (Current Results)
- Political composition: Presidential voting patterns by state
- Food environment: Fast-food establishments per capita (USDA Economic Research Service)
- Public safety: Crime rates per 100,000 population (World Population Review)
- Environmental quality: Air Quality Index averages (World Population Review)
- Cultural infrastructure: Museums per capita (Kaggle/IMLS)
- Natural resources: National parks count (NationalParkTrips.com)
2. Speculative Classification System
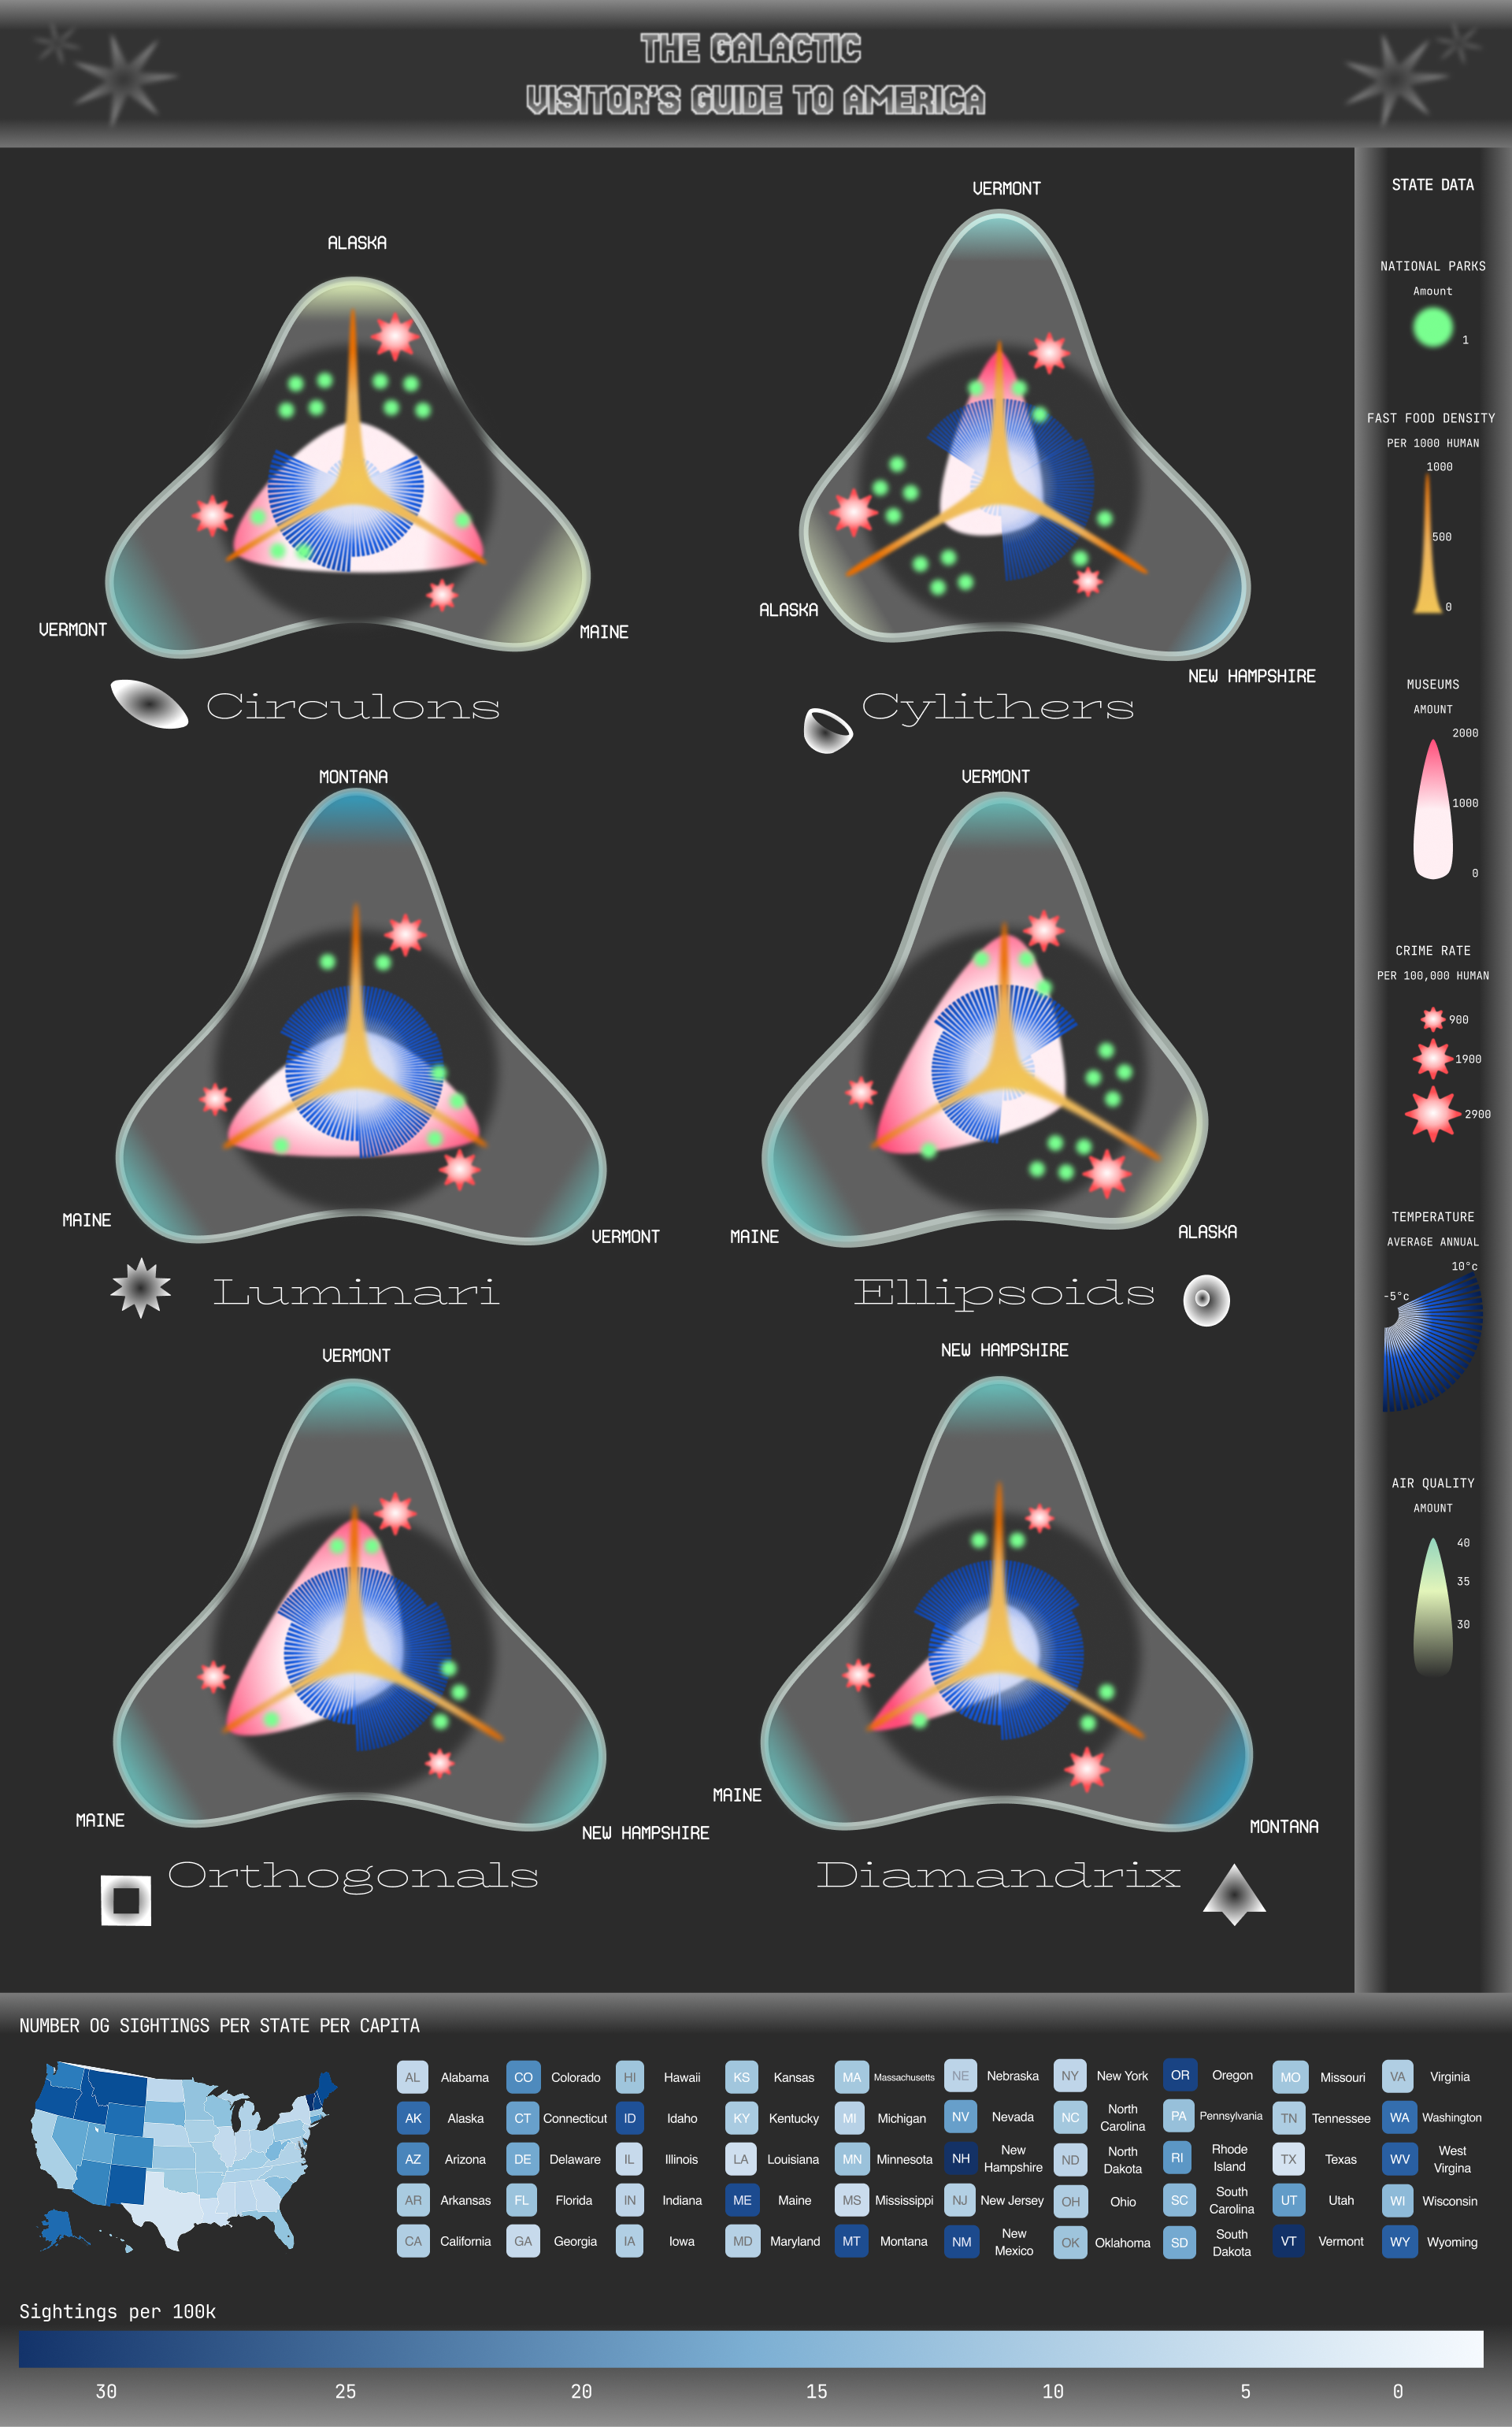
UFO shape descriptors in NUFORC data were grouped into six fictional "species" based on reported craft morphology:
| Species | Description | Shape Categories |
|---|---|---|
| Circulons | Disc/circular craft | Circle, disc, round |
| Cylithers | Cylindrical vessels | Cylinder, cigar, tube |
| Luminari | Light phenomena | Light, orb, sphere, fireball |
| Ellipsoids | Oval craft | Oval, egg, teardrop |
| Orthogonals | Angular vessels | Triangle, rectangle, box |
| Diamandrix | Diamond formations | Diamond, chevron, boomerang |
This taxonomy serves dual purposes: it provides an analytical structure for grouping heterogeneous reports, while the playful nomenclature signals the speculative nature of the framing.
3. Statistical Analysis
For each species category:
- Frequency calculation: Aggregated sighting counts by state
- Population normalization: Calculated sightings per 100,000 residents to account for demographic differences
- State ranking: Identified the top three states per species by normalized frequency
- Variable mapping: For each state, compiled contextual indicators listed above
- Data standardization: Normalized all variables to 0-1 scale for comparative visualization
4. Visual Encoding Strategy
Primary Visualization: Multi-axis Radar Charts
Each species is represented by a triangular radar chart where:
- Axes = Top three states by sighting frequency for that species
- Concentric layers = Contextual variables (temperature, crime, air quality, etc.)
- Visual metaphor = Charts as "decision compasses" for hypothetical alien tourists
This encoding creates a multi-dimensional portrait of each location, allowing viewers to compare how different variables align across states preferred by different craft types.
Secondary Visualization: Choropleth Map
A U.S. map shows overall sighting density (normalized by state population) to provide geographic context for the species-specific analysis.
5. Aesthetic Framework
The visual design deliberately evokes mid-century science fiction aesthetics:
- Dark cosmic background suggests nocturnal observation conditions
- Luminous, translucent forms reference UFO iconography
- Retro-futuristic typography reinforces speculative framing
- Glowing data layers create an "otherworldly" atmosphere that signals interpretive play
This aesthetic strategy is not merely decorative—it continuously reminds viewers that the framing is speculative, preventing misinterpretation of the visualization as factual claim.
Results and Findings
Observed Correlations
Species-State Patterns:
The analysis revealed distinct geographic preferences for different craft morphologies:
- Circulons (discs) appear most frequently in Vermont, Alaska, and Maine—states with high museum density, low fast-food prevalence, and moderate temperatures
- Luminari (lights) concentrate in Montana, Maine, and Vermont—characterized by low population density and high air quality
- Orthogonals (triangular craft) favor Vermont, Maine, and New Hampshire—the New England cluster suggests regional reporting patterns
Interpreting the Patterns
These correlations do not suggest that disc-shaped craft "prefer" culturally rich environments, but rather that:
- Demographic factors influence reporting behavior: Rural states with lower light pollution may produce more night sky observations
- Cultural context shapes classification: Residents of different regions may categorize ambiguous aerial phenomena differently
- Regional reporting clusters suggest social transmission: Sighting reports may influence subsequent reports in the same area
- Environmental conditions affect visibility and interpretation: Weather patterns, air quality, and natural phenomena vary by region
The visualization makes these correlations visible without asserting causation, creating space for viewers to interrogate their own assumptions about what the data represents.
What the Data Reveals
Rather than answering "what are UFOs?", the project demonstrates how:
Perception is systematically patterned
Sighting reports are not randomly distributed but cluster along recognizable demographic, geographic, and environmental boundaries—suggesting that what we see (or report seeing) is shaped by where we are and who we are.
Data requires interpretive framing
The same dataset can tell radically different stories depending on analytical approach. Our "tourism guide" framing reveals patterns that might be invisible in traditional statistical analysis.
Visualization is an act of storytelling
All data visualization involves interpretive choices. By making the speculative framing explicit, the project acknowledges that visualization shapes understandin
Technical Implimentation
Data Processing Pipeline
NUFORC Raw Data (60k+ records)
    ↓
Data cleaning: standardize location fields, remove incomplete records
    ↓
Shape classification: map free-text descriptions to six species categories
    ↓
Geographic aggregation: count sightings by state and species
    ↓
Population normalization: calculate per capita rates using U.S. Census data
    ↓
State ranking: identify top 3 states per species
    ↓
Contextual data integration: join state-level indicator datasets
    ↓
Variable standardization: min-max normalization to 0-1 scale
    ↓
Statistical analysis: correlation testing (Python/NumPy)
    ↓
Visualization generation: radar chart coordinates (Matplotlib)
    ↓
Visual refinement: composition and typography (Adobe Illustrator)
    ↓
Geographic mapping: choropleth creation (QGIS)
    ↓
Final composition: digital visualisation
Technical Challenges
Challenge 1: Classification Ambiguity
UFO shape descriptions in NUFORC data are inconsistent—the same phenomenon might be described as "bright light," "sphere," "orb," or "ball of light." Solution: Developed a keyword-matching algorithm with manual verification of edge cases.
Challenge 2: Interpretive Clarity
Risk of misinterpretation—viewers might take speculative framing literally. Solution: Explicit use of fictional species names, sci-fi aesthetic, and prominent legend explaining the speculative approach.
Reflection
Epistemological Implications
This project operates at the intersection of data science and critical design. The speculative framing serves as a method for interrogating how we construct knowledge from uncertain data:
Data Objectivity:
Traditional data visualization often presents itself as objective representation. By explicitly adopting a fictional frame, we acknowledge that all visualization involves interpretive choices—selection, classification, encoding, aesthetic treatment—that shape how data is understood.
Methodological Insights
The Value of Speculative Framing:
Our initial attempts at straightforward statistical analysis produced conventional results: geographic clustering, demographic correlations, seasonal variations. The breakthrough came when we reframed the entire dataset through the "alien tourism" lens. This shift transformed dry statistics into an engaging narrative that invited viewers to question their own interpretive impulses.
Working with "Messy" Cultural Data:
UFO reports resist conventional data cleaning approaches. They are subjective, inconsistent, influenced by cultural narratives, and fundamentally ambiguous. Rather than treating this messiness as a limitation, we embraced it as the subject of inquiry. The question shifted from "how do we make this data clean?" to "what does this messiness reveal about collective perception and belief?"
Data Sources
Primary Data:
- National UFO Reporting Center (NUFORC). "All Reports Database." Accessed November 2024. https://nuforc.org/
Contextual Data:
- Current Results. "Average Annual State Temperatures." https://www.currentresults.com/Weather/US/average-annual-state-temperatures.php
- U.S. Department of Agriculture, Economic Research Service. "Food Environment Atlas." https://www.ers.usda.gov/data-products/food-environment-atlas/
- World Population Review. "Crime Rate by State" and "Air Quality by State." https://worldpopulationreview.com/
- Institute of Museum and Library Services (IMLS) via Kaggle. "Museum Directory Dataset." https://www.kaggle.com/datasets/imls/museum-directory/
- NationalParkTrips.com. "U.S. National Parks by State List." https://www.nationalparktrips.com/