An Aura of Words: Green Spaces of Lugano
A scrollytelling interface that transforms citizen language — Google Reviews of five Lugano parks — into a visual semantic portrait called an aura, provoking debate about how public space is experienced.
Annabelle Conron, Nerea Asensio, Nicholas Vos, Jeremy Martin, Julie Alme
GitHub repository | Live Visualisation
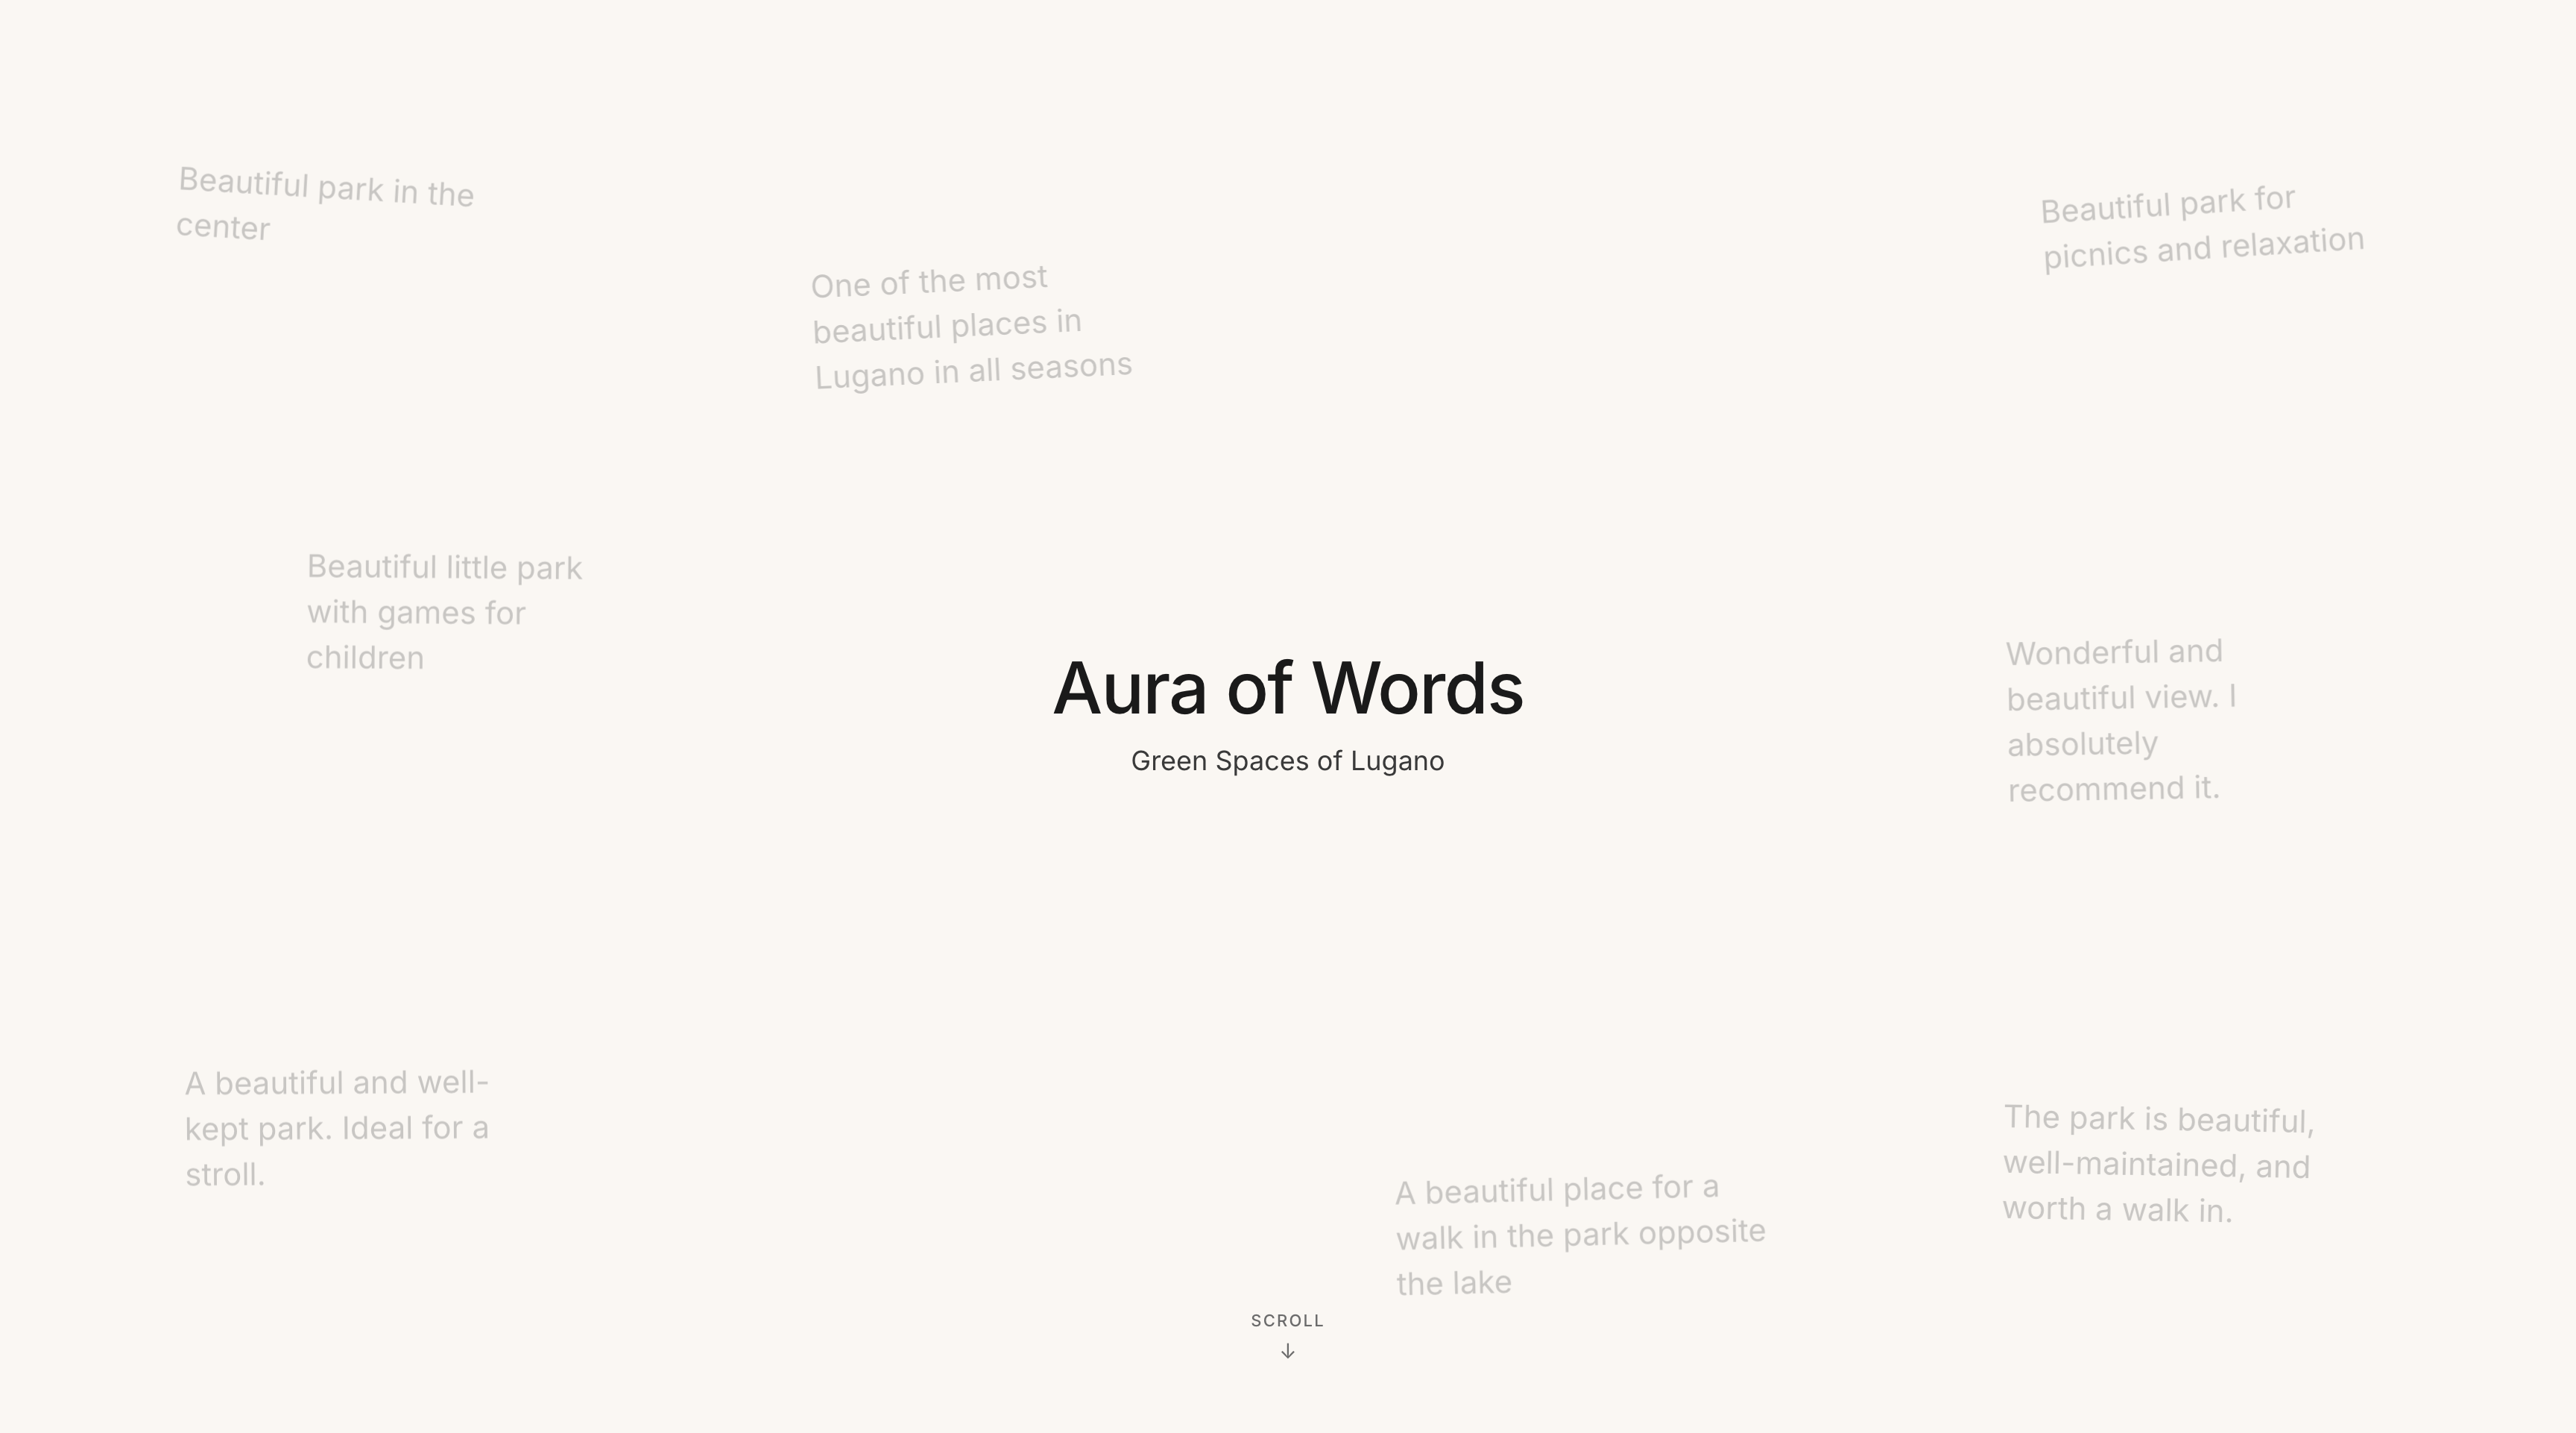
Opening page
Abstract
An Aura of Words is a scrollytelling interface that transforms citizen language — Google Reviews of five Lugano parks — into a visual portrait called an aura. By encoding over 3,400 words into six semantic lenses, the project provokes a question: does this portrait match how you see this park? It invites both individual reflection and collective debate about how public space is experienced and valued.
Does Lugano's green space data tell the full story? Explore the six profiles and see how the parks are perceived by those who visit them. Does it ring true from your perspective? What is missing? What would you add?
Debate
Public parks are officially described through institutional channels: planning documents, maintenance reports, facility inventories. These records tell you what is physically present but they say little about how citizens actually experience, feel about, and assign meaning to those spaces. An Aura of Words starts from a different premise: the language citizens use, when writing a review after a park visit, contains a richer and more honest portrait of a place than any official record. The challenge is that this language is vast, unstructured, and dispersed across hundreds of individual reviews. On its own, it is difficult to read at a glance.
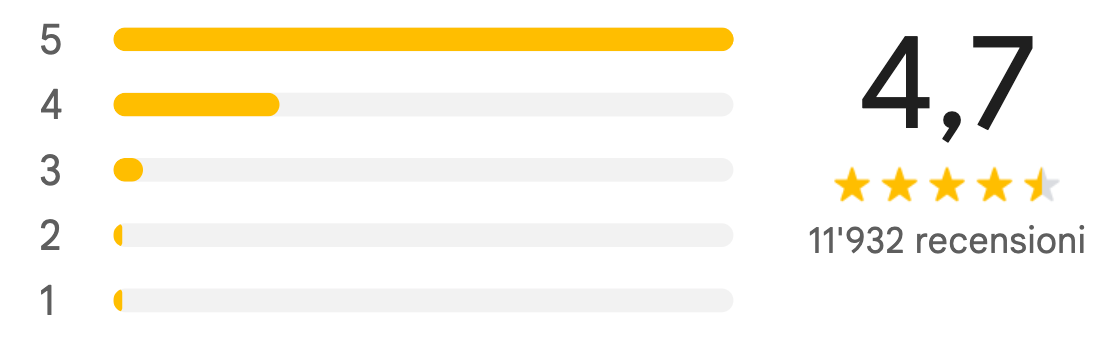
Citizen contribution interface
The project's central proposition is that this qualitative language can be encoded — systematically transformed into a visual form that is immediately legible — without losing what makes it valuable: its texture, its subjectivity, its contradictions. The result is the aura: a colour-weighted portrait of each park built entirely from citizen words.
But encoding is not neutral, and a portrait is not a fact. Once the aura is visible, the interface turns it into a provocation: "Is this how you see this park?" This question opens a debate that operates on two levels simultaneously. At the individual level, it invites each viewer to test the portrait against their own experience. At the collective level, it makes visible the fact that different people experience the same park differently. The debate is not about whether parks are good or bad — it is about whose experience counts in how we understand public space, and whether the collective voice of citizens, once made legible, can tell us something that official channels cannot.
Dataset
Type of Data
The project uses citizen-generated textual data: written Google Reviews of five public green spaces in Lugano. The dataset consists of natural language text in multiple languages (primarily Italian, German, English, and French), star ratings, and review dates.
Reviews are informal, unstructured, and unprompted — voluntary testimony from people who chose to write after a visit. This distinguishes them from surveys or structured feedback forms. The project's argument is that this informality is a feature, not a flaw: it is precisely what makes reviews a meaningful portrait of how parks are actually experienced.
Platforms and Sources
Data was collected from Google Maps using a custom Python script built with Playwright. For each park, the script opened the reviews panel, scrolled to load up to 500 entries, and extracted the written review text, star rating, date of publication, and reviewer name. Only reviews containing written text were retained; star-only ratings were excluded as uninformative for language analysis.
Selected Parks:
- Parco Ciani — 1,620 reviewed words
- Parco Tassino — 856 reviewed words
- Parco San Michele — 550 reviewed words
- Parco Panoramico Paradiso — 369 reviewed words
- Parco Lambertenghi — 65 reviewed words
Data Categorisation
A category framework was developed through exploratory brainstorming over 100 reviews. An initial five-category set was proposed, then validated against the full dataset with Claude. Upon completing the full corpus (3,400+ word occurrences), the categories were reconsidered from scratch. This process confirmed the five initial categories were broadly sound but revealed a significant gap: reviewers frequently named specific physical features in a way that didn't fit neatly into sensory or emotional language. A sixth category, Infrastructure/Amenities, was added.
| Category | What it captures |
|---|---|
| Experiential–Emotional | The inner state of the visitor — how the park made them feel |
| Sensory–Environmental | Perceptual qualities — colour, sound, light, smell, texture |
| Action | Activities and behaviours — what people did or came to do |
| Relational Context | Social identity — who was there, who the park is for |
| Tension/Complaint | Negative signals — crowding, neglect, disappointment, friction |
| Infrastructure–Amenities | Physical features and facilities — benches, fountains, paths, playgrounds |
Filtering Words into Categories
Each review was processed by mapping terms to one of six semantic categories using a manually curated semantic lexicon. For each park's review corpus, every occurrence of every lexicon term was identified using regex word-boundary matching. For each matched term, the following was recorded: the term, its category, its frequency, and a context excerpt from the surrounding review text.
This produced a structured dataset with one row per occurrence — a term appearing 12 times would generate 12 rows, each with its own unique context excerpt. The final output covers 5 parks and approximately 3,729 total rows.
Contextual Co-occurrence
To capture the full meaning of each review rather than isolated words, each row was enriched with co-occurring terms from the same excerpt. For every occurrence of a lexicon term, the script searched the surrounding excerpt for any other lexicon terms, recording both the co-occurring term and its category. The output included up to seven co-occurring pairs per row — a limit derived from the excerpt with the highest number of co-occurring terms in the dataset.
Coverage: 78% of the 3,729 rows had at least one co-occurring term, meaning the large majority of word occurrences are connected to at least one other meaningful word in context. This co-occurrence data forms the structural foundation for both the weighted aura calculation and any future network or word-map visualisation.
Visualisation
The visualisation encodes the proportional distribution of semantic categories within each park's review corpus. It shows: the proportional weight of each of the six categories across all categorised words per park; word-by-word categorisation of a single review; the aggregate aura of each park; comparative review volume across parks; and geographic location of parks on the Lugano map.
Design Choices
Colour — Each of the six semantic categories is assigned a distinct colour consistent across the entire interface: purple (Experiential–Emotional), green (Sensory–Environmental), blue (Action), yellow (Relational Context), orange (Infrastructure–Amenities), red (Tension–Complaint).
Shape and Size — The park aura takes the form of an organic, colour-blended blob. The relative area occupied by each colour represents the proportional weight of that category in the park's reviews. A subtle breathing animation reinforces its character as a living portrait rather than a fixed chart.
The Single-Review Annotation Sequence — This sequence walks through a single review word by word as the user scrolls. Each meaningful term is highlighted in its category colour and boxed; a running counter accumulates category weights in real time, building toward the aura. The viewer watches the portrait being constructed.
The Map — The five parks appear on a map of Lugano, each represented by its aura blob at its geographic location. The physical size of each aura corresponds to the volume of reviews collected. Clicking a park transitions to its individual view.
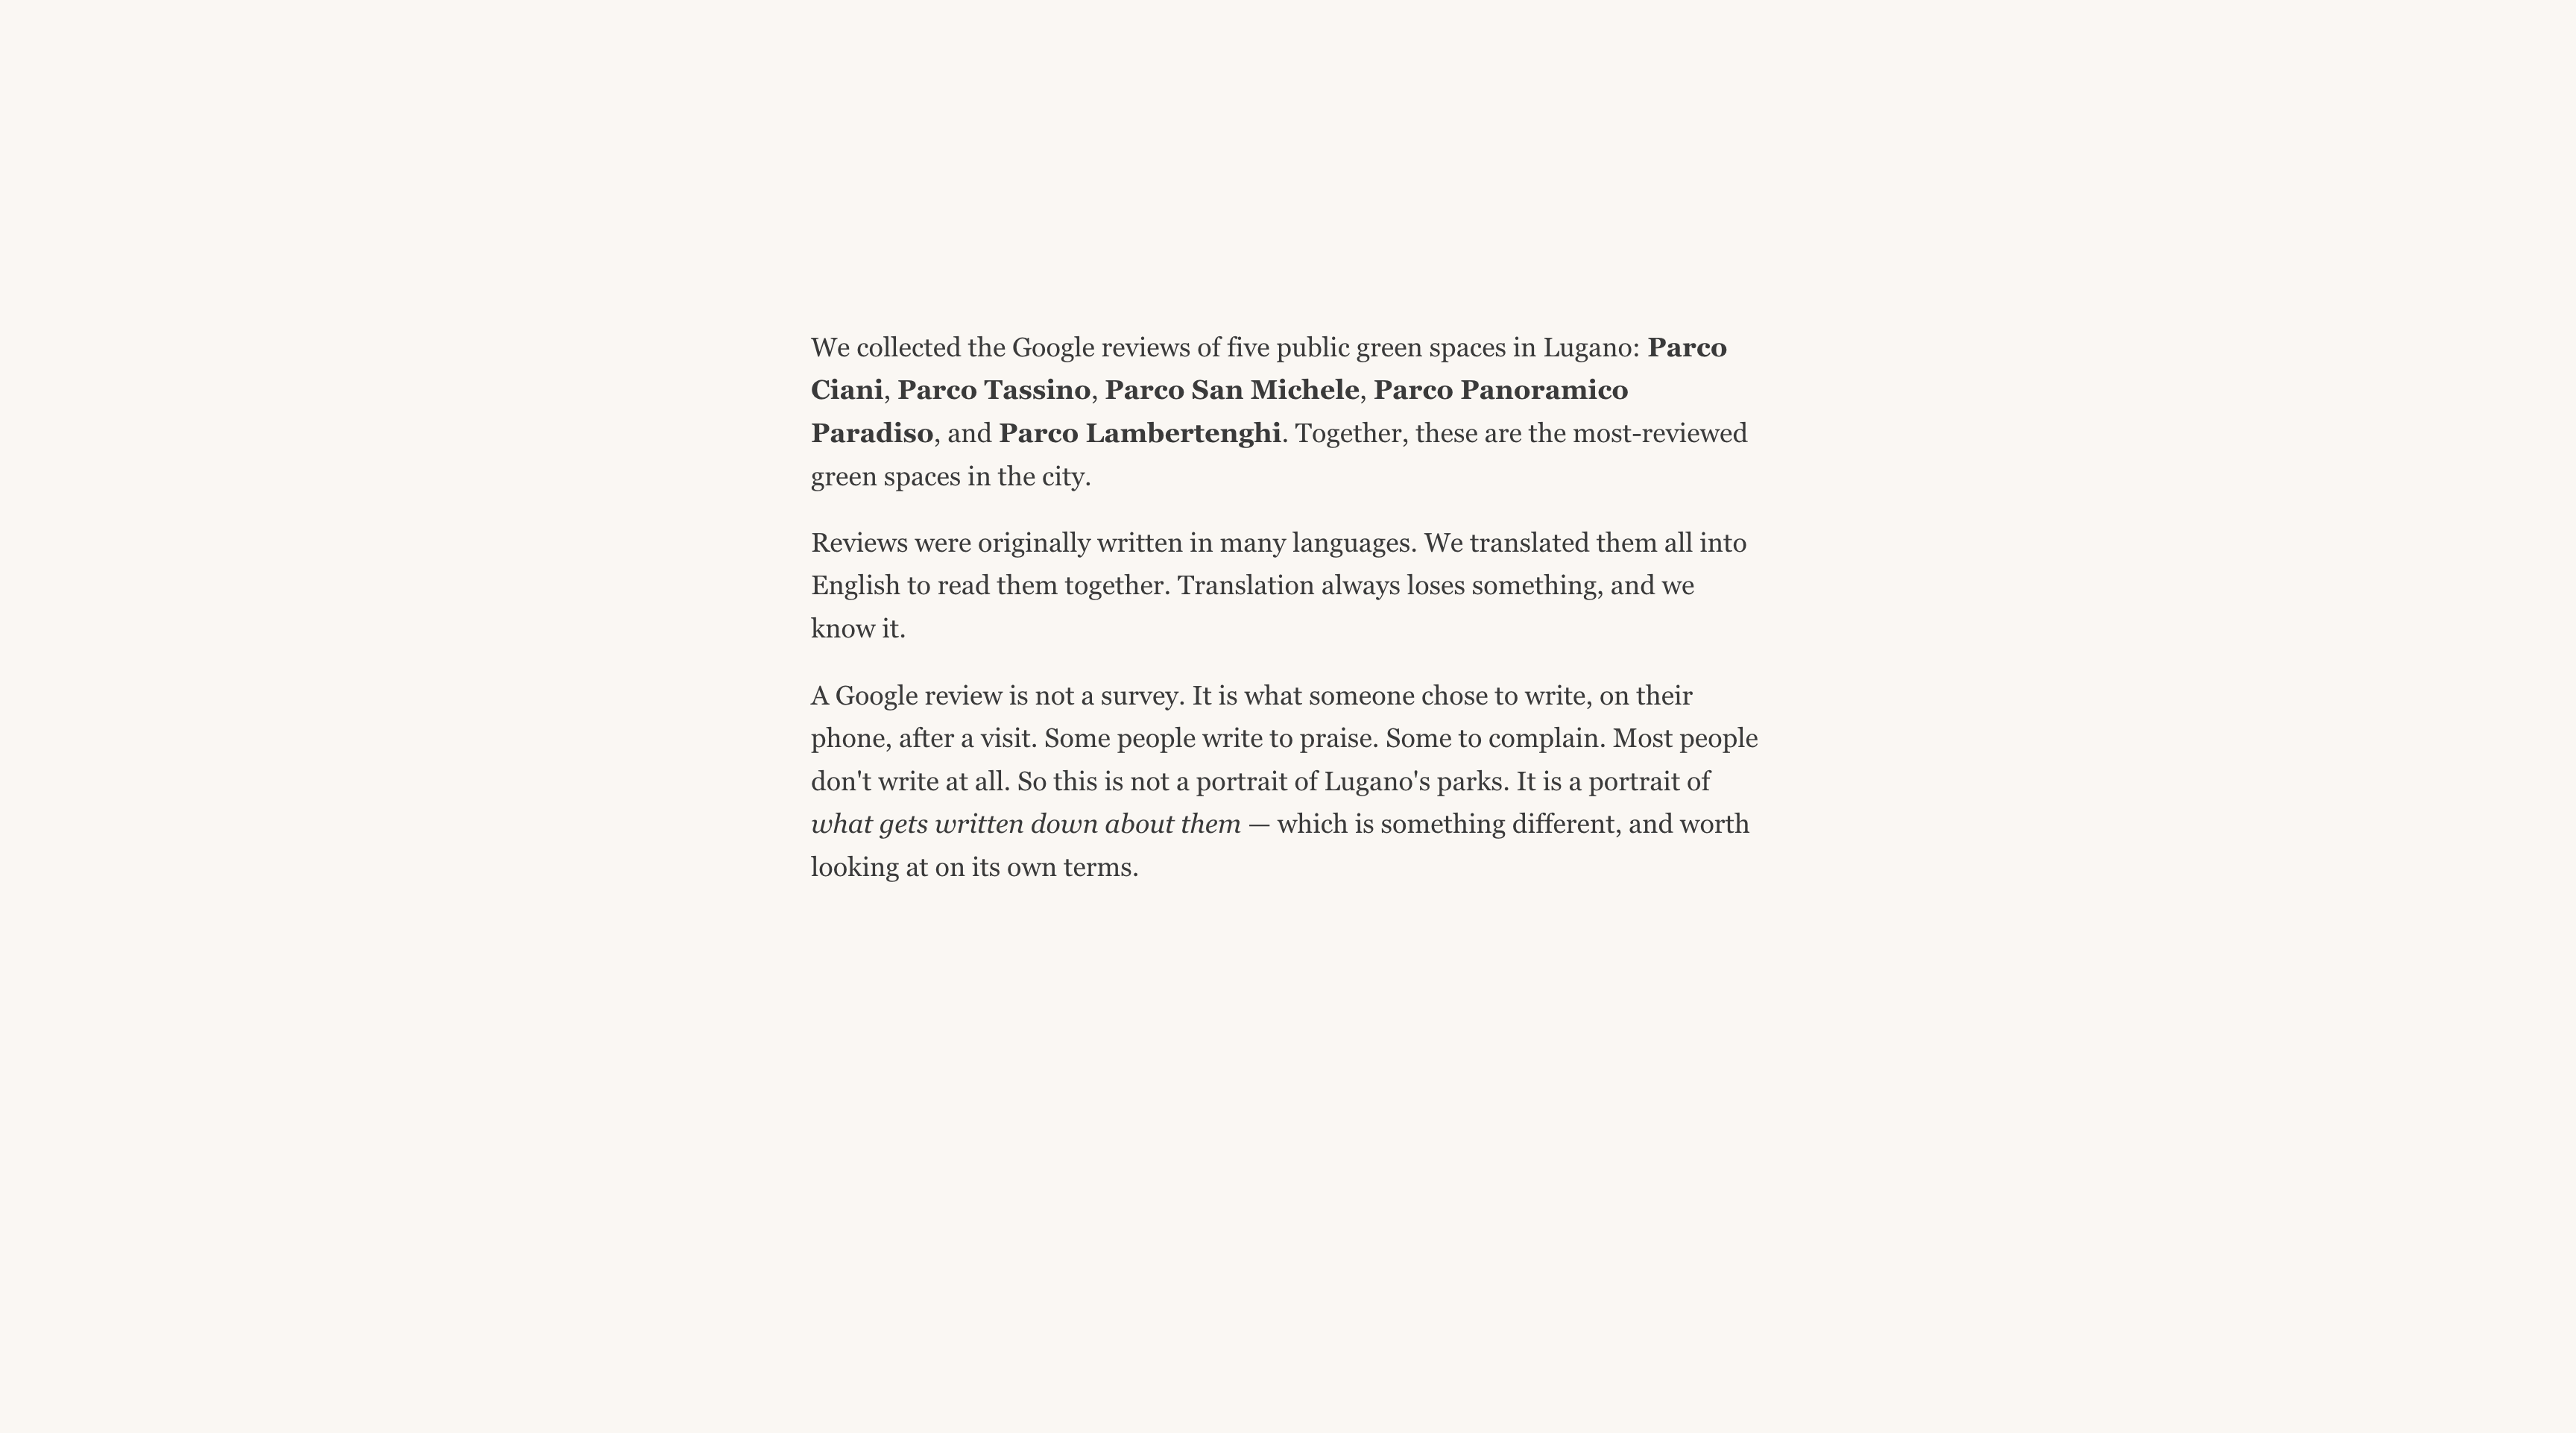
Method overview
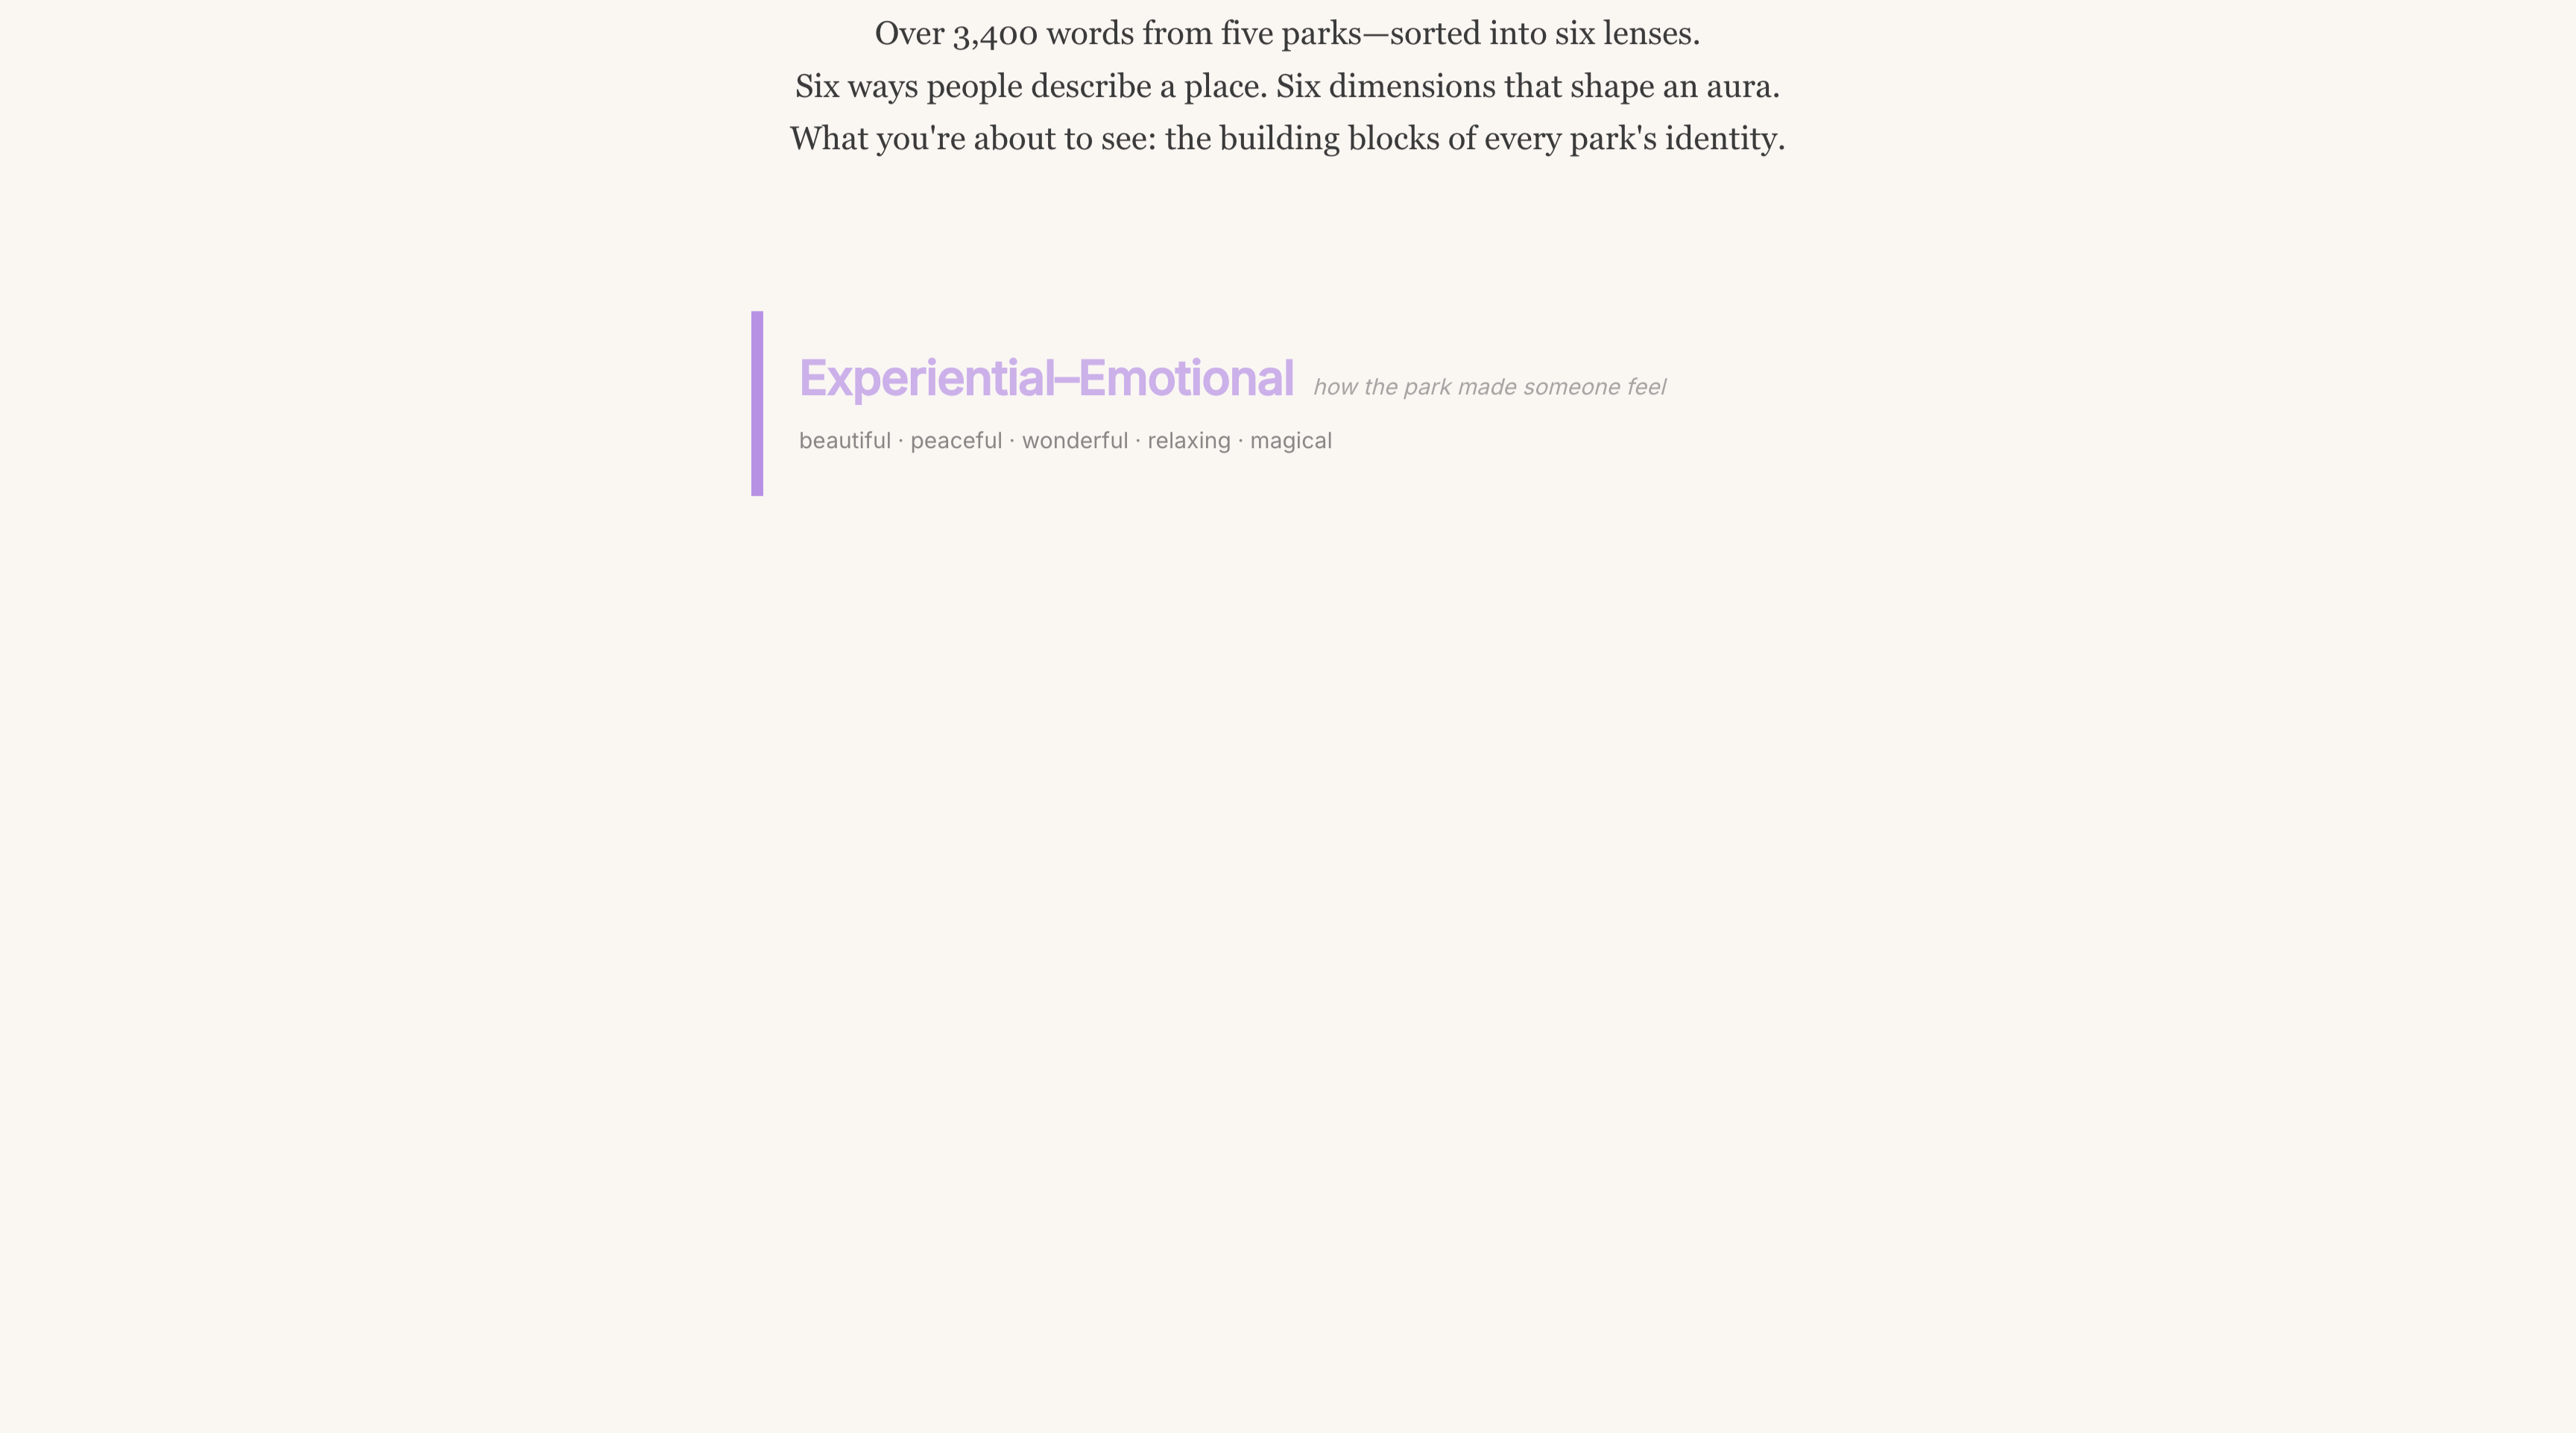
Six semantic category lenses
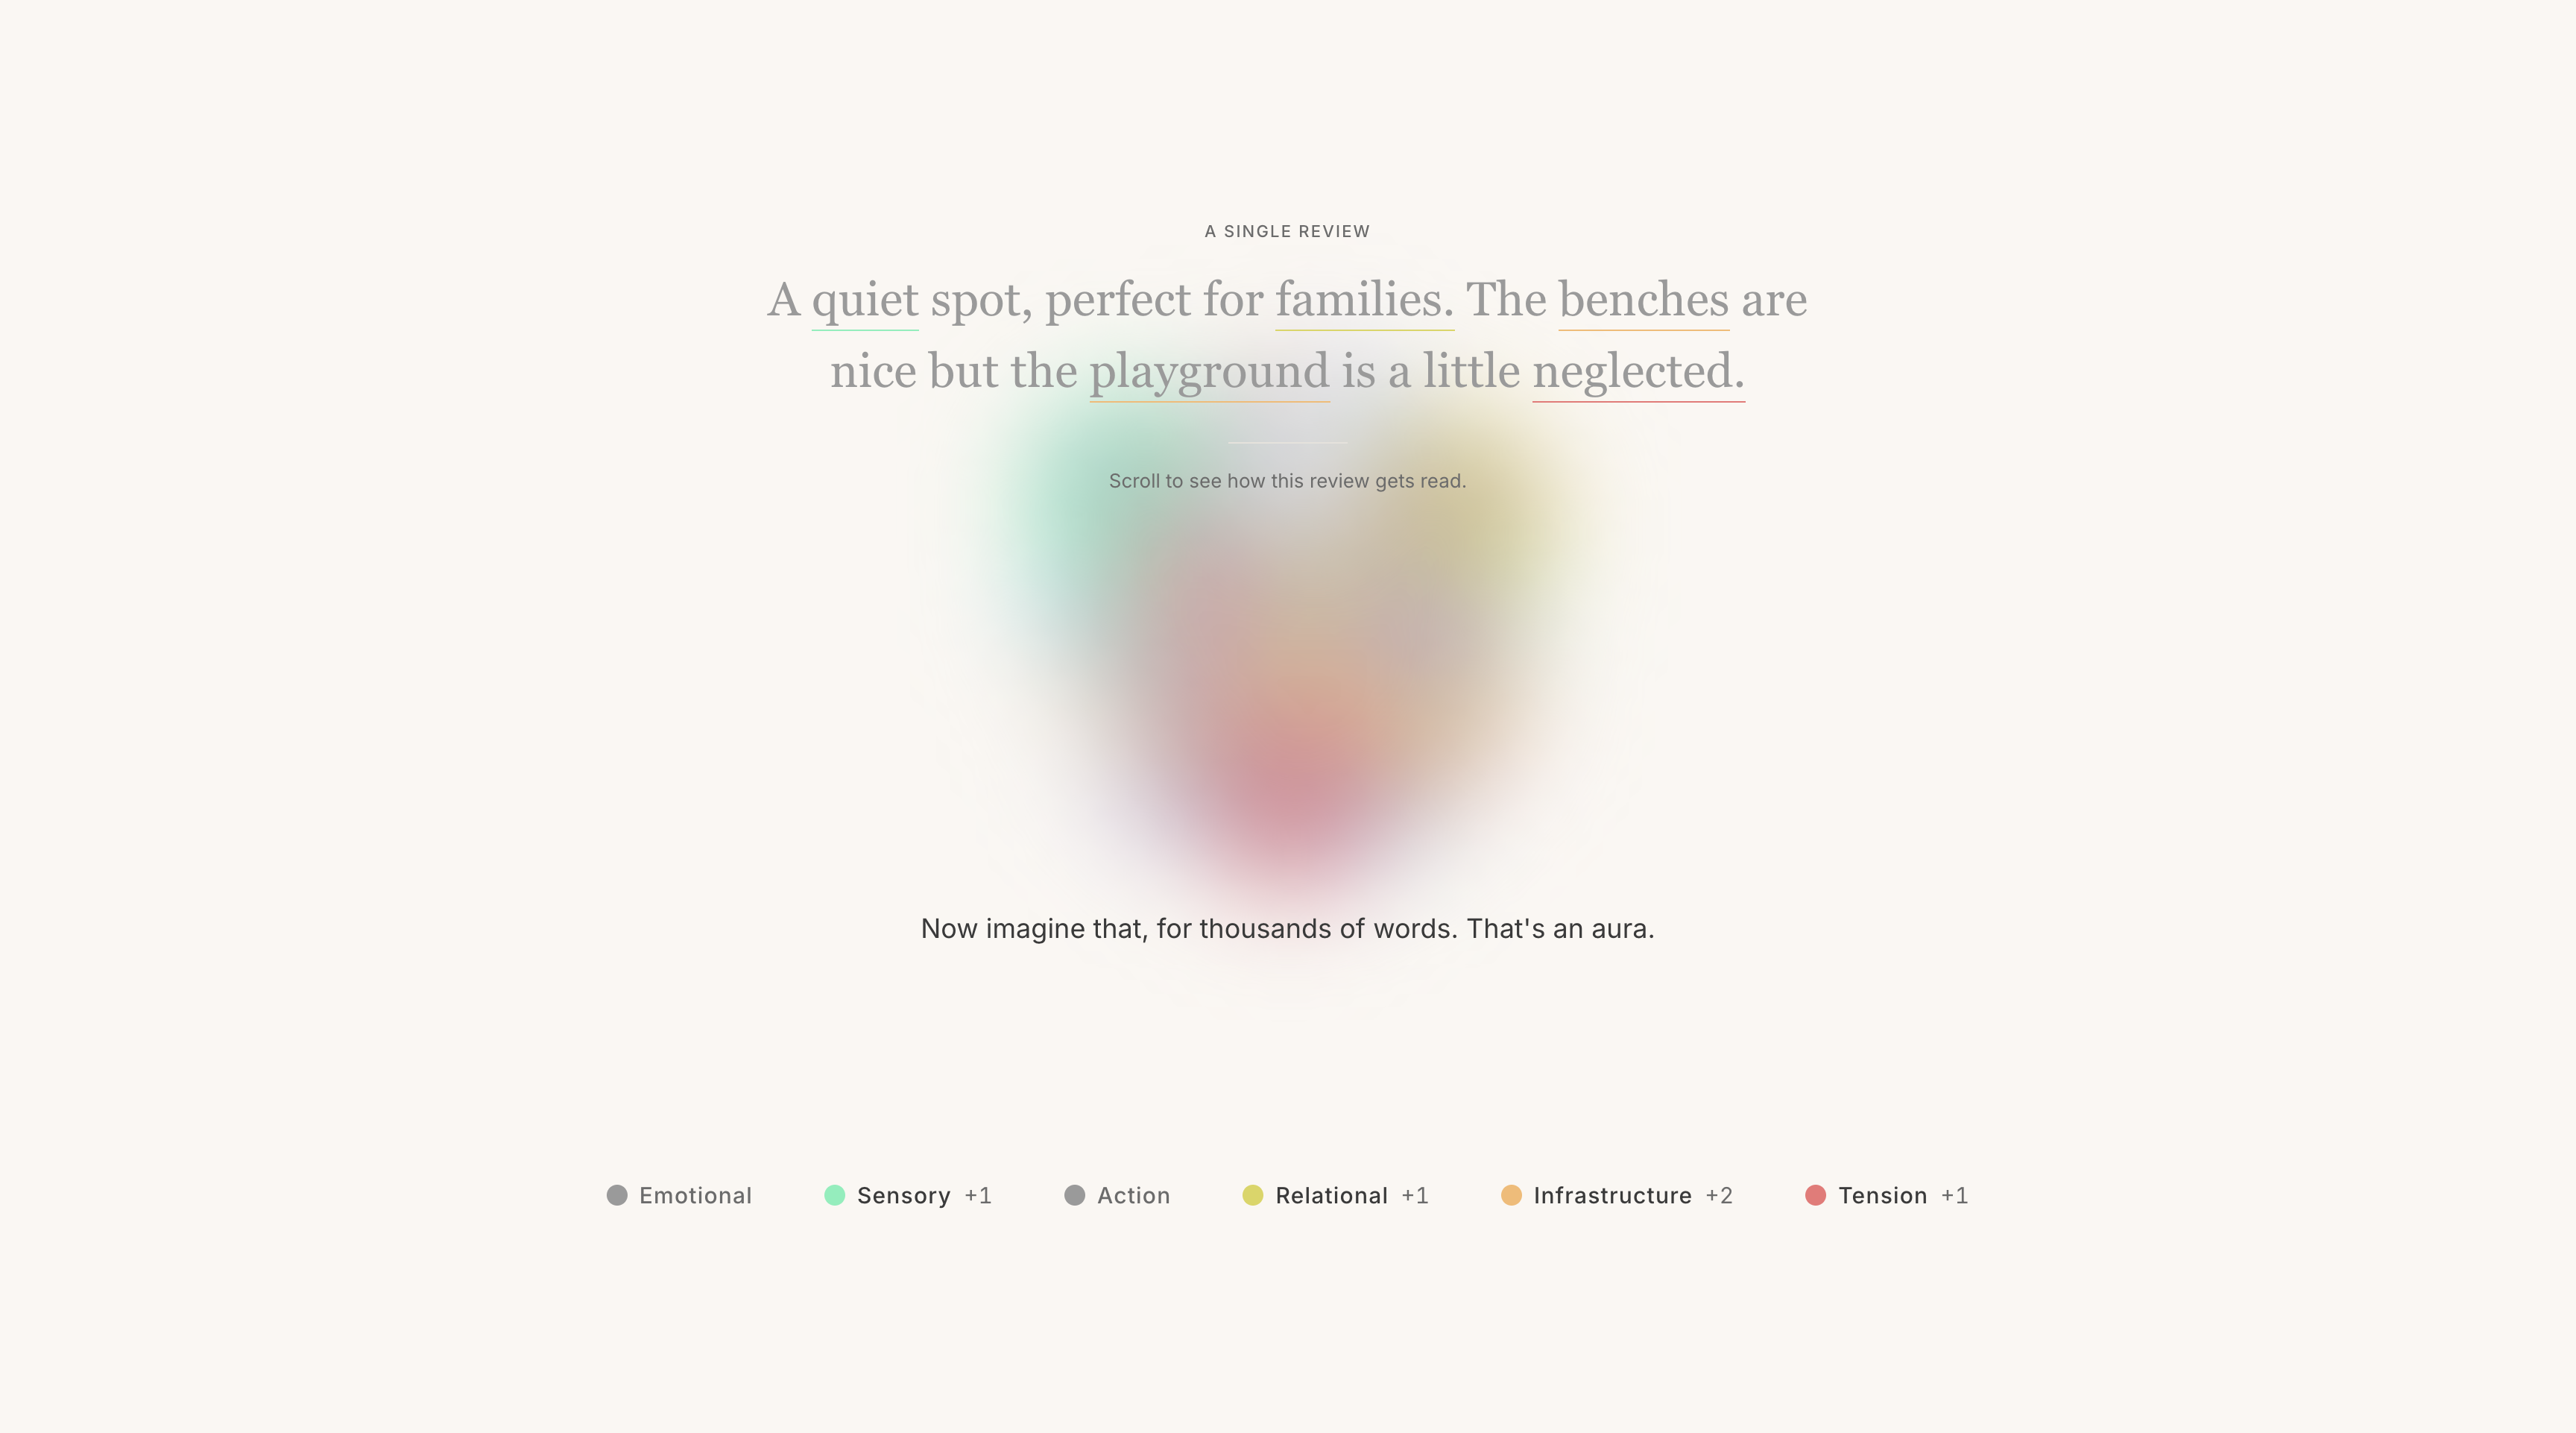
Methodology and full aura creation
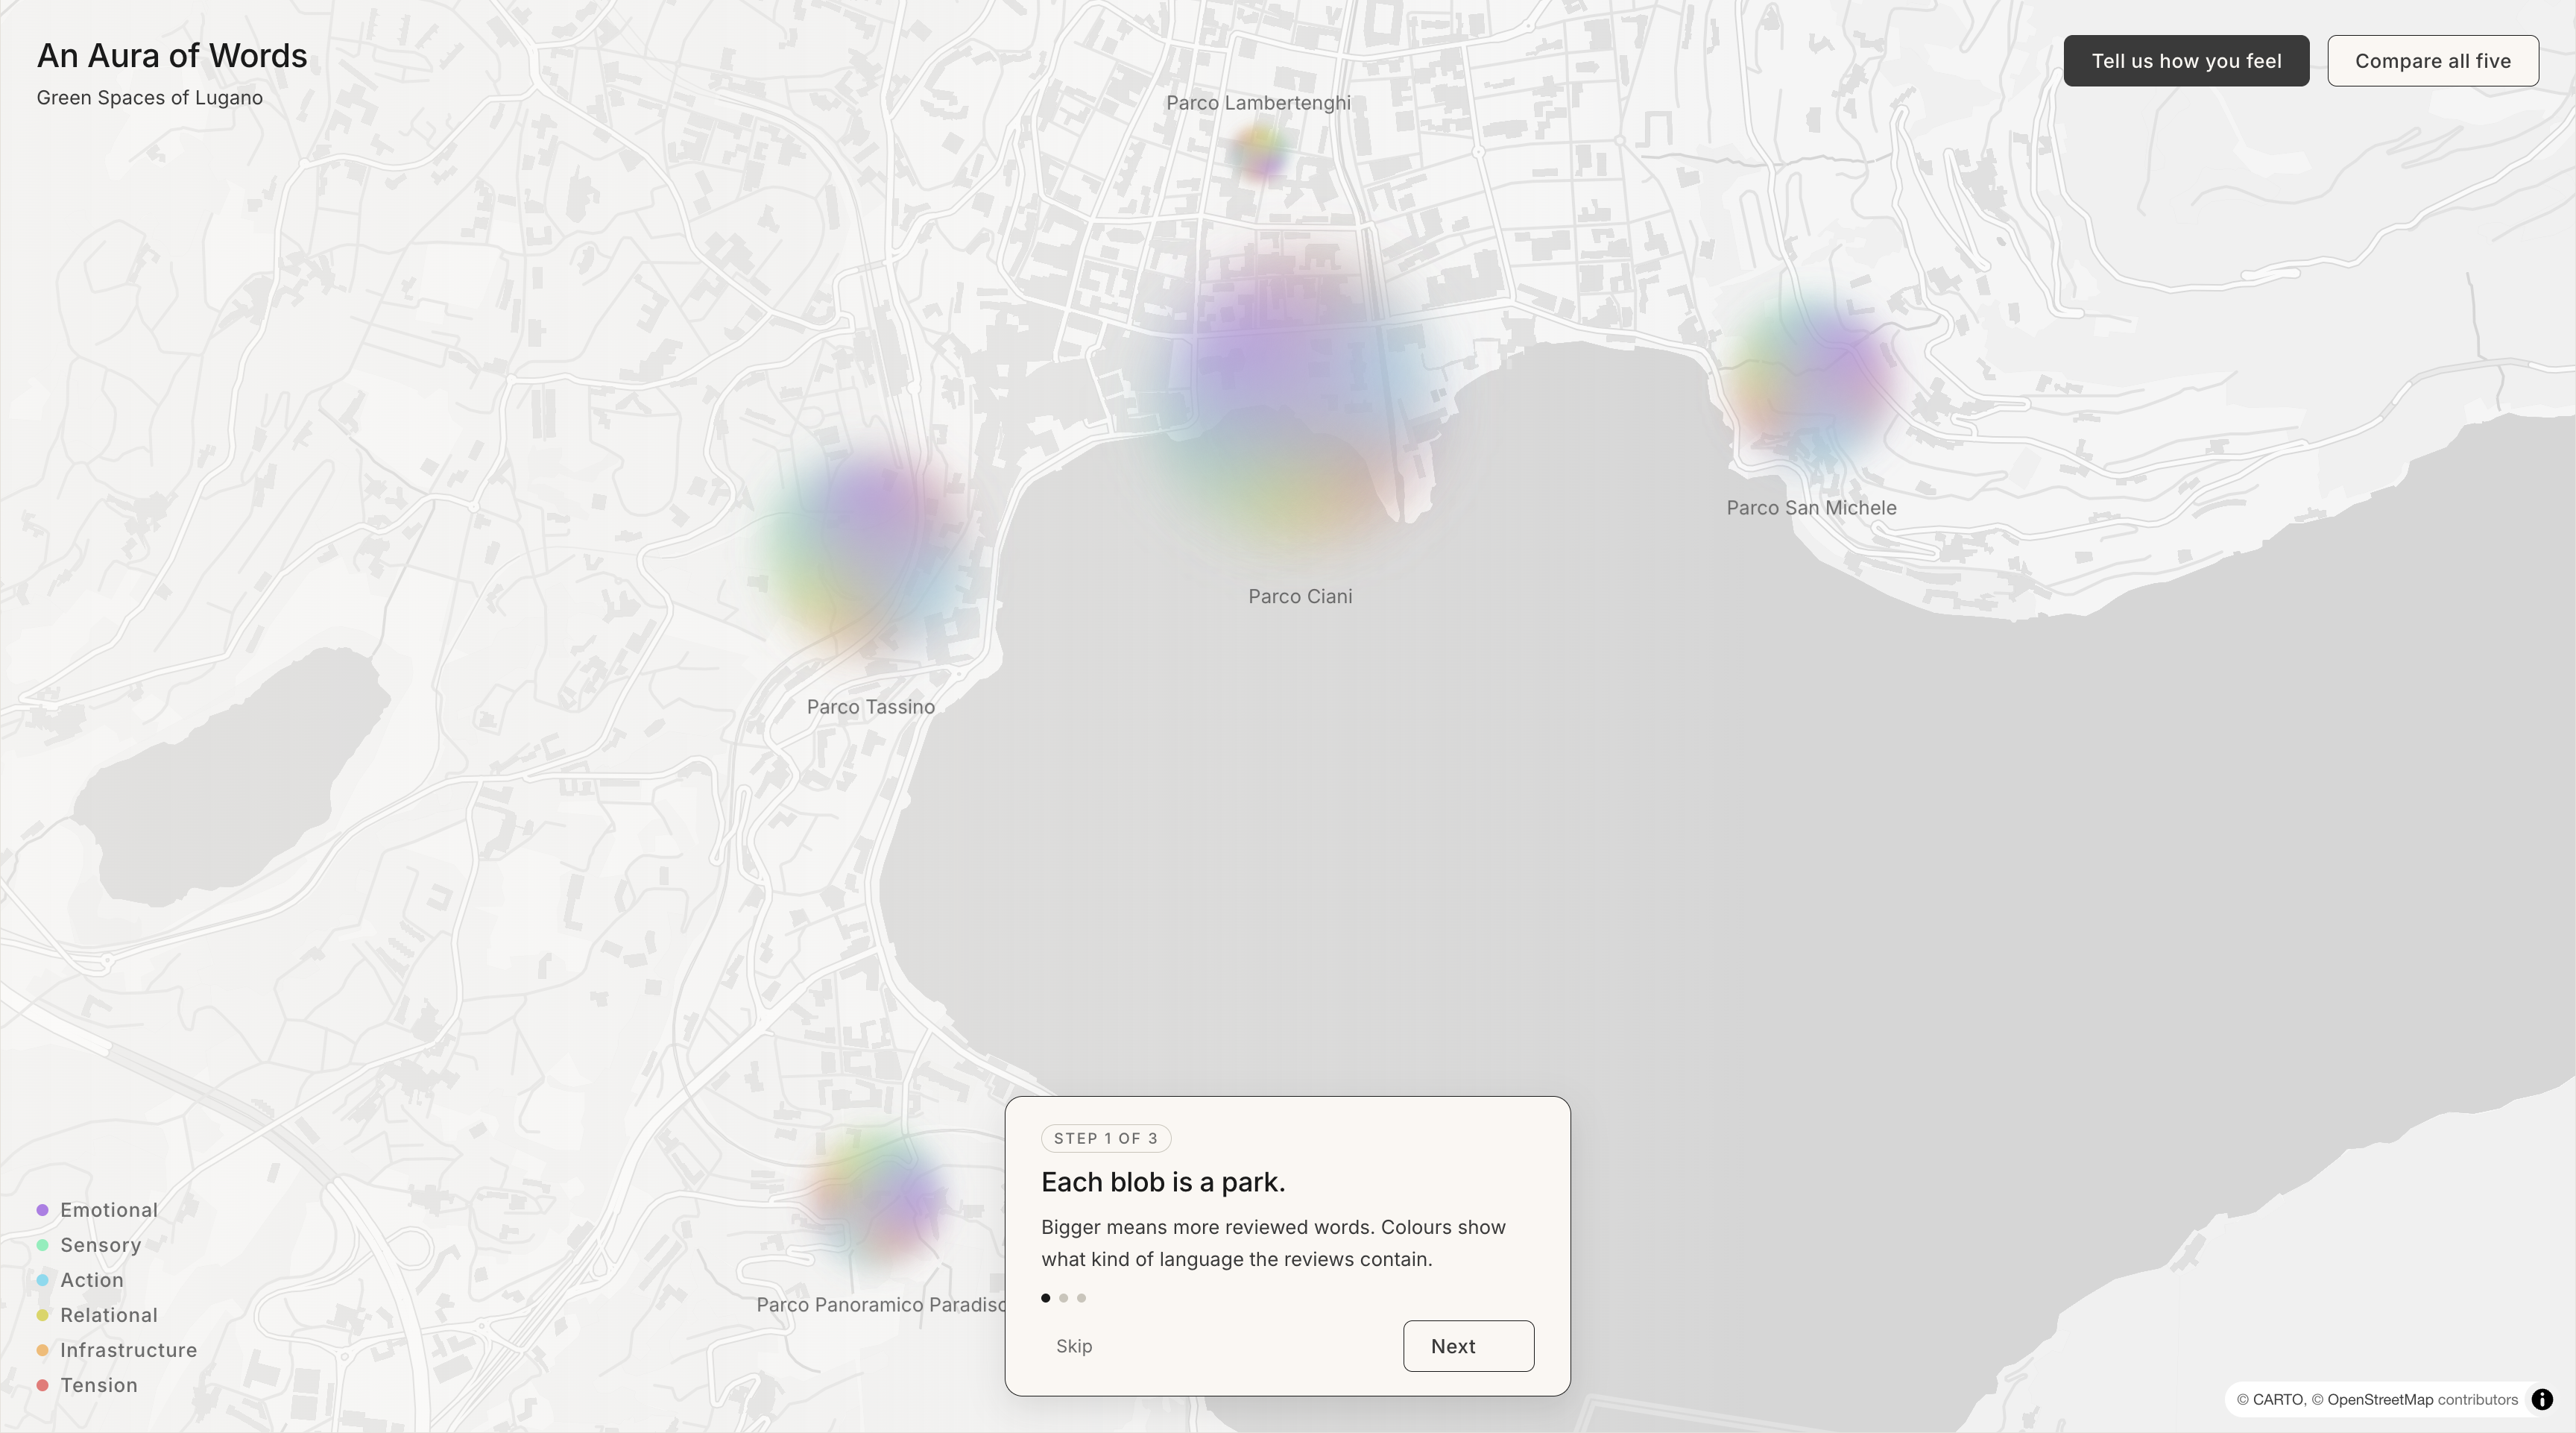
Aura map of Lugano parks
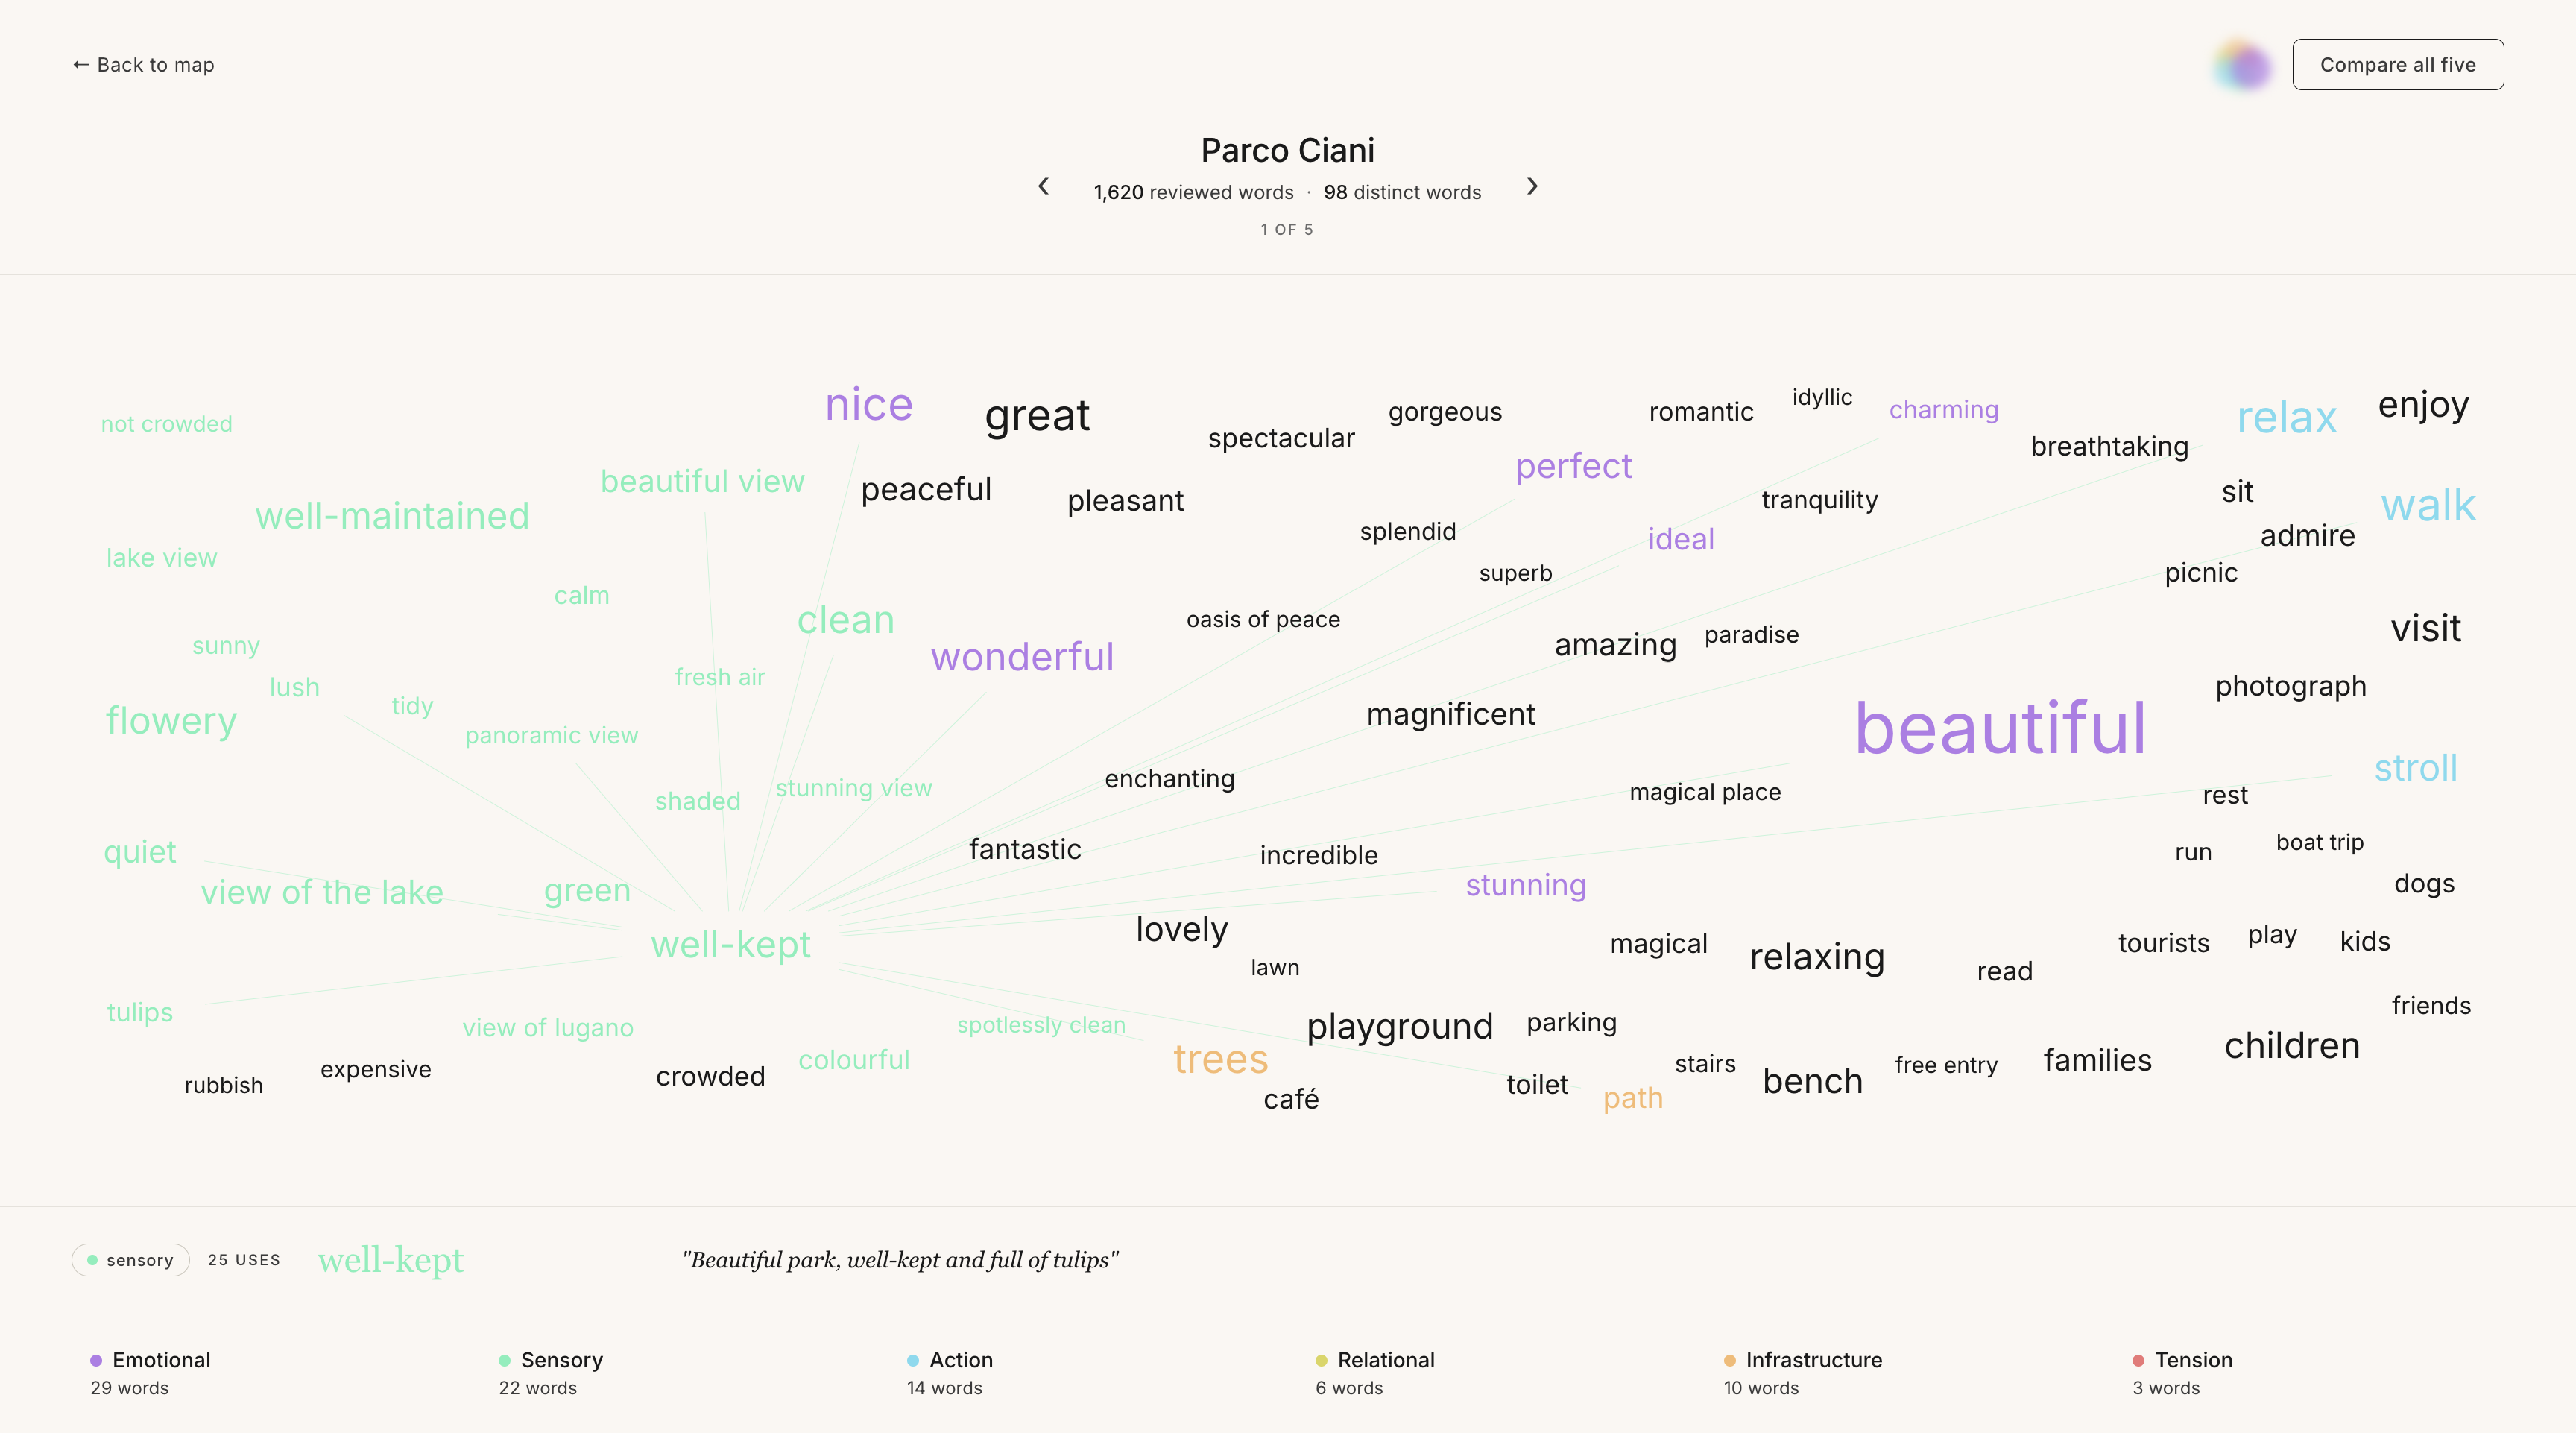
Word map — aura detail
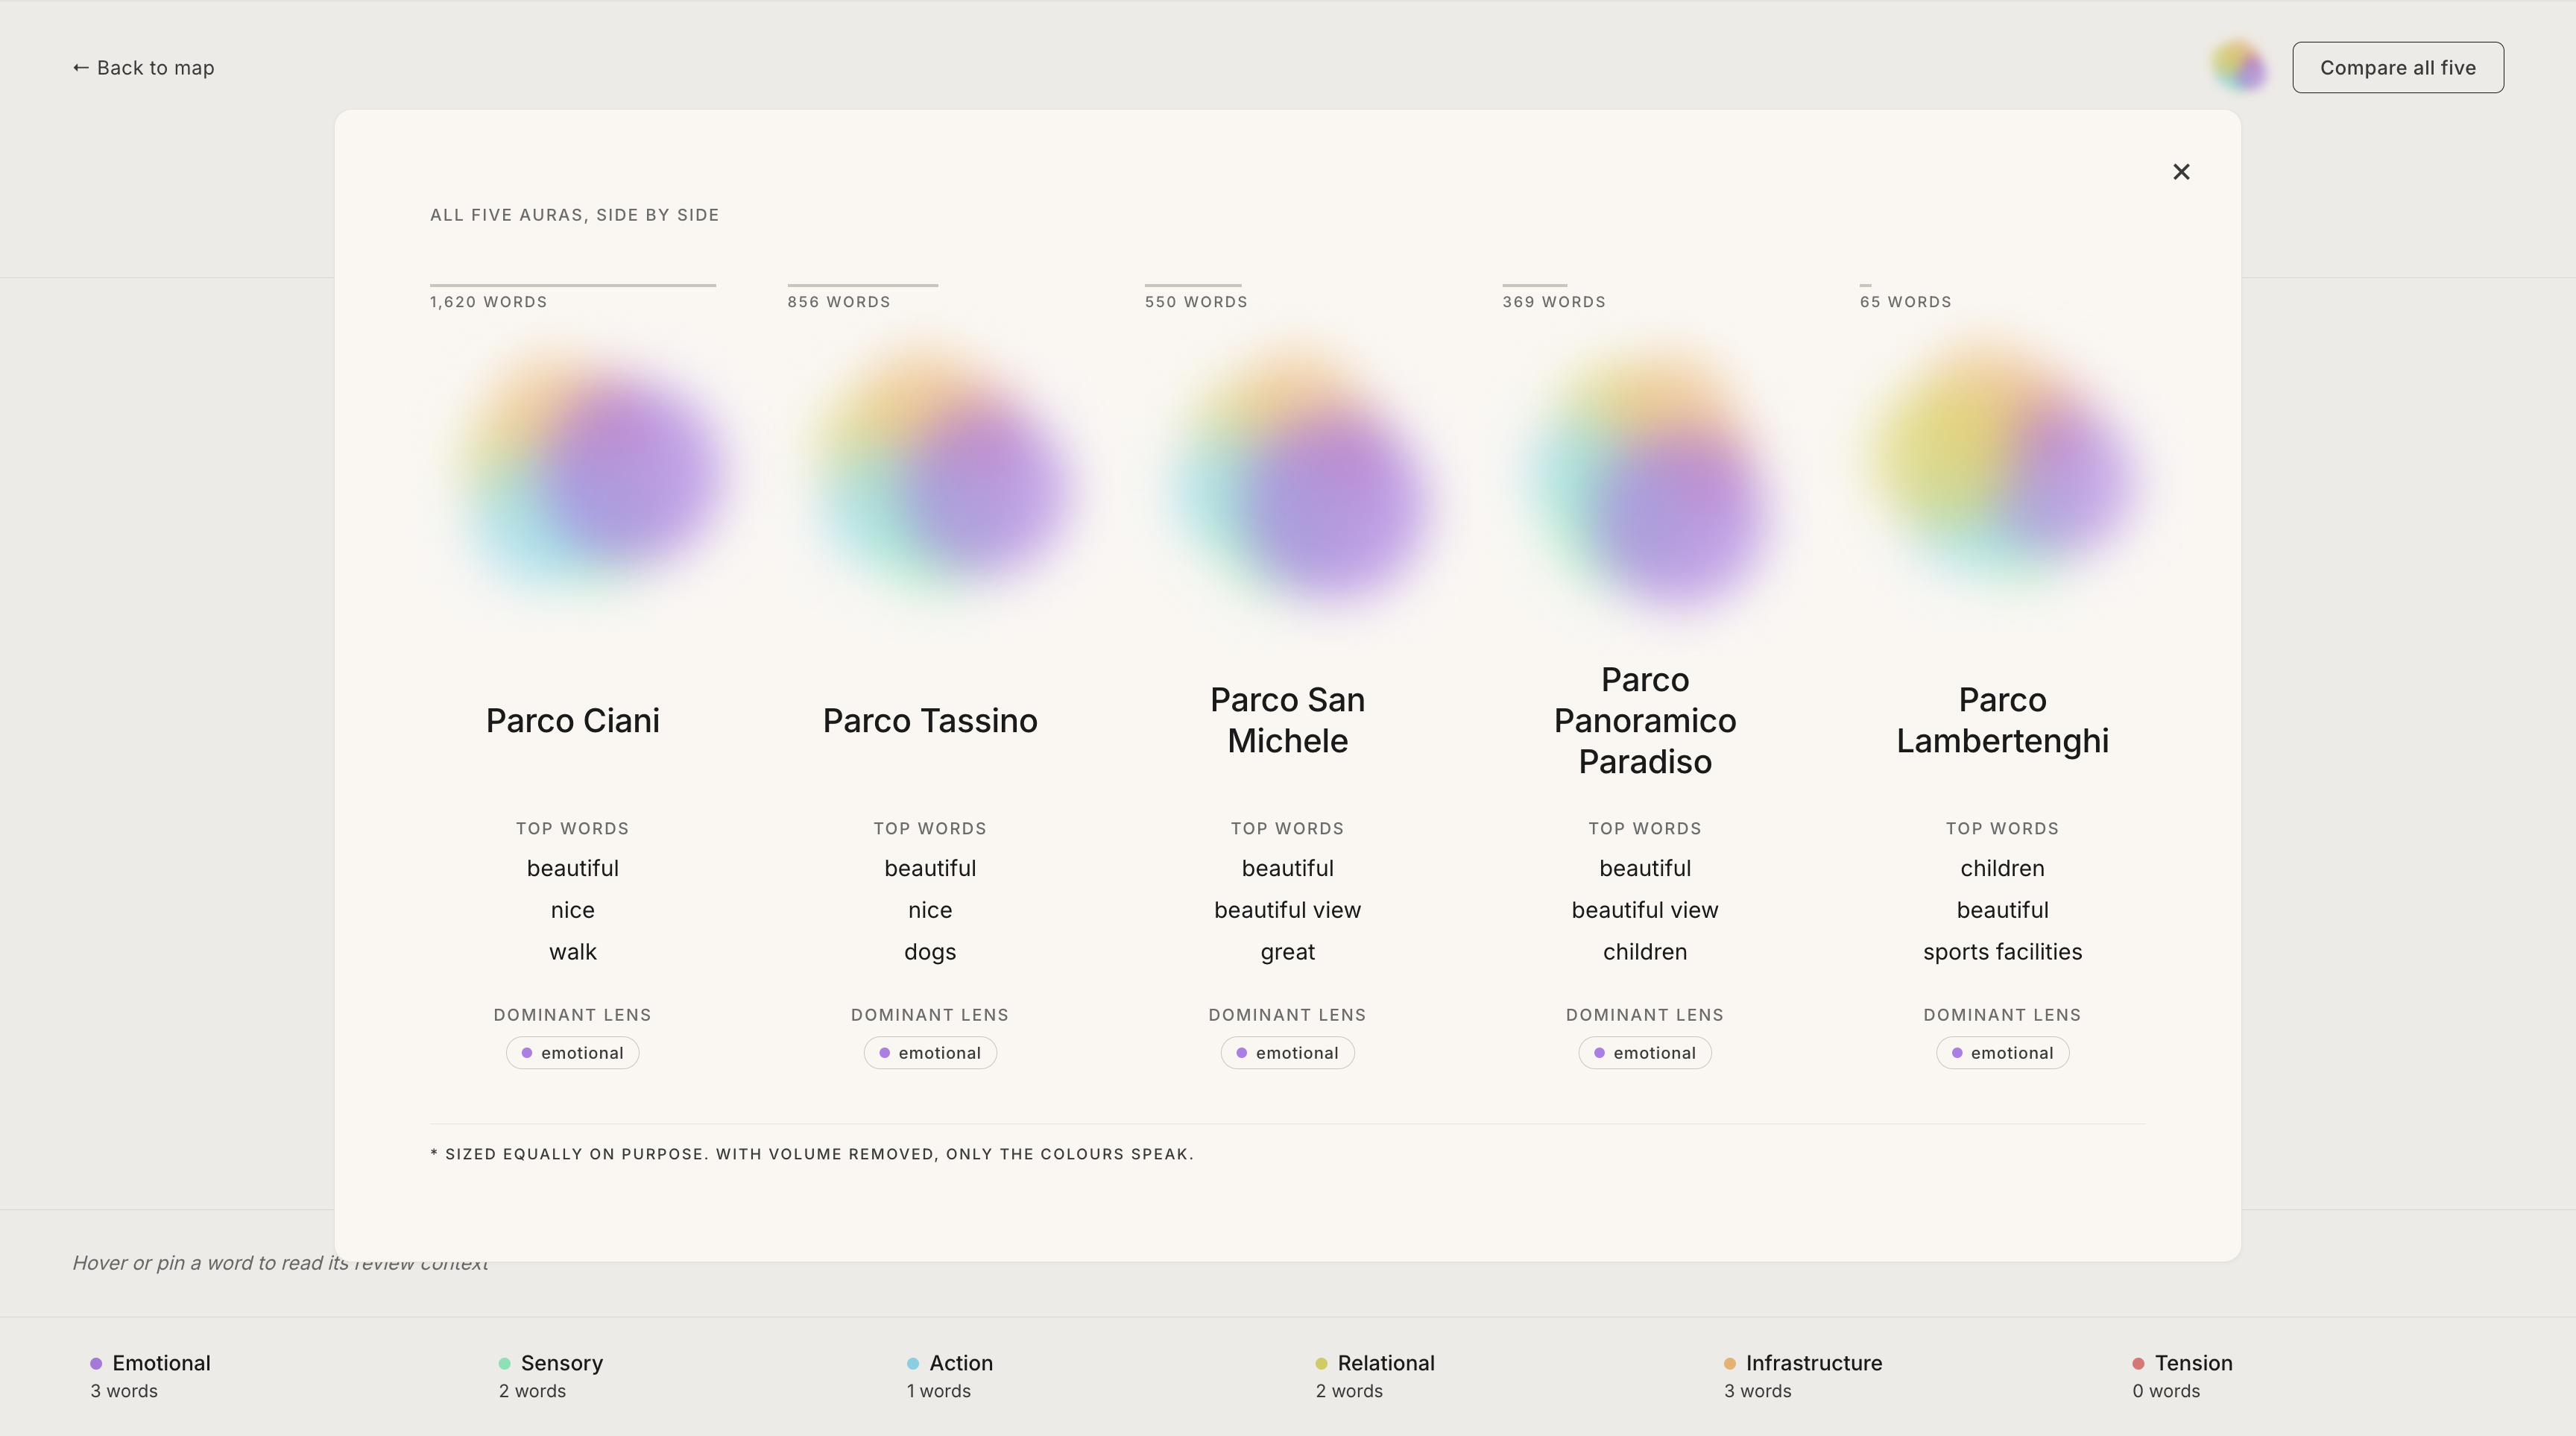
Aura comparison across parks
Data Contribution
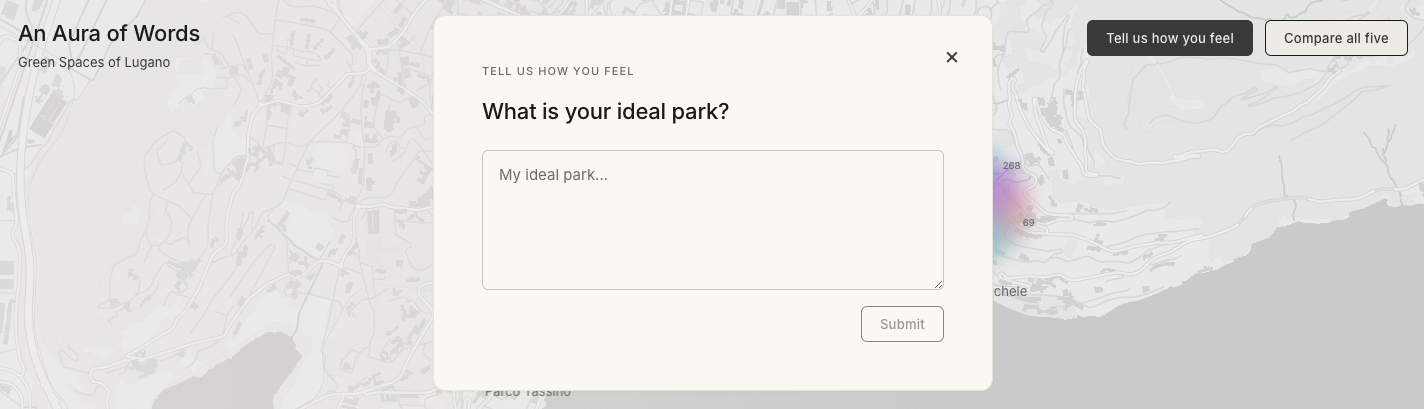
Citizen contribution prompt
The interface includes a participatory layer that invites citizens to contribute their own voice to the experience. Through a simple free-text prompt — "What is your ideal park?" — users describe, in their own words, the green space they wish existed.
As the user types, the system reads their words in real time, classifying them against the same six lenses used to analyse the Google Reviews. Words light up in the colours of their category: a sensory term turns green, a relational word glows amber. The user does not just contribute data — they watch their own language being interpreted, making the methodology visible at the very moment of participation.
Interface
The interface is designed as an immersive scrollytelling experience, guiding users through the data-driven narrative of Lugano's green spaces.
The Introduction — The journey begins with the project title set against a dynamic backdrop of Google Review snippets, grounding the digital experience in real human sentiment.
Context and Framework — After introducing the project abstract, the interface outlines the six-category framework. These categories act as lenses through which the diverse "personalities" of the city's parks are defined.
The Methodology Lab — A demonstration phase visualises the transformation of raw data. Users see how scraped reviews are dissected, categorised, and assigned specific colours — the foundational building blocks of the final aura.
Interactive Mapping — The user arrives at the interactive map of Lugano, with each park represented by its aura blob at its geographic location. Scale corresponds to review volume; internal colour distribution reflects category density. Users can dive into a granular view of each individual park.
The Call to Action — The experience concludes with the citizen contribution prompt described above.
Outdoor exhibition poster
Interface walkthrough
Sources